A New Era of Ocean Observation
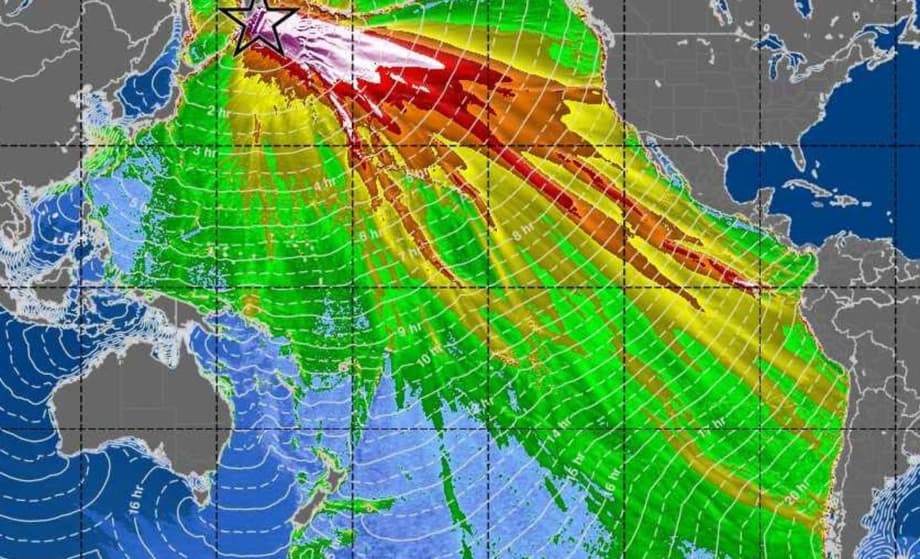
When a powerful magnitude 8.8 earthquake tore through the Kuril-Kamchatka subduction zone on July 29, 2025, it did more than just shake the ground beneath the remote Russian peninsula. It launched a massive tsunami across the Pacific Ocean and provided scientists with a rare natural experiment. By a stroke of fortuitous timing, the Surface Water and Ocean Topography (SWOT) satellite, a joint mission between NASA and the French space agency CNES, passed directly over the affected area. This passage resulted in the first high-resolution, spaceborne swath of a great subduction-zone tsunami ever recorded.
The imagery captured by SWOT went far beyond a simple snapshot of a wave. Instead of the single, neat crest often depicted in textbooks, the satellite revealed a complicated, braided pattern of energy dispersing and scattering over hundreds of miles. These are intricate details that traditional ocean instruments almost never resolve. The results offer much more than a striking picture; they suggest that the fundamental physics used to forecast tsunami hazards may require a significant revision.
For decades, scientists have operated under the assumption that the largest ocean-crossing waves travel as largely “non-dispersive” packets. This new data challenges that notion, forcing a re-evaluation of how we model these destructive forces.
From Point Measurements to Panoramic Views
Until this event, deep-ocean monitoring relied heavily on the DART (Deep-ocean Assessment and Reporting of Tsunamis) buoy system. These buoys have served as our best open-ocean sentinels. They are exquisitely sensitive, capable of detecting millimeter-scale changes in water pressure, but they are sparse. Each buoy provides a time series at a single point, leaving vast gaps of the ocean unobserved.
SWOT transforms this paradigm by mapping a 75-mile-wide swath of sea surface height in a single pass. This capability lets scientists see the tsunami’s geometry evolve in both space and time, rather than just guessing what happens between isolated buoys.
Angel Ruiz-Angulo, the lead author of the study from the University of Iceland, described the impact of this new data vividly. “I think of SWOT data as a new pair of glasses,” Ruiz-Angulo said. “Before, with DARTs we could only see the tsunami at specific points in the vastness of the ocean. There have been other satellites before, but they only see a thin line across a tsunami in the best-case scenario. Now, with SWOT, we can capture a swath up to about 120 kilometers (75 miles) wide with unprecedented high-resolution data of the sea surface.”
A Surprise Discovery in the Data
NASA and CNES launched SWOT in December 2022 with the primary goal of surveying surface water around the world to better understand global ocean dynamics and climate change. Ruiz-Angulo and co-author Charly de Marez had been poring over its data for two years, focusing on analyzing small ocean eddies.
They never imagined they would capture a tsunami. “We had been analyzing SWOT data for over two years understanding different processes in the ocean like small eddies, never imagining that we would be fortunate enough to capture a tsunami,” the researchers noted.
Classic teaching holds that big, basin-spanning tsunamis behave as shallow-water waves. Because their wavelength is so much larger than the ocean depth, they theoretically march along without breaking into separate components or losing their shape. SWOT’s snapshot argued otherwise for this specific event.
“The SWOT data for this event has challenged the idea of big tsunamis being non-dispersive,” said Ruiz-Angulo.
When the research team ran numerical models that included dispersive effects, the simulated wave field matched the satellite pattern far better than the “non-dispersive” runs typically used in forecasting.
The Importance of Dispersion
This distinction is not merely academic. Dispersion refers to the tendency of waves to separate based on their speed as they travel. In a tsunami context, dispersion repackages the wave train’s energy as it approaches land.
“The main impact that this observation has for tsunami modelers is that we are missing something in the models we used to run,” Ruiz-Angulo explained. “This ‘extra’ variability could represent that the main wave could be modulated by the trailing waves as it approaches some coast. We would need to quantify this excess of dispersive energy and evaluate if it has an impact that was not considered before.”
This means the trailing waves behind the main crest could arrive with different timing and energy than previously predicted, potentially altering how coastal engineers design defenses and how authorities issue evacuation orders.
Refining the Source of the Waves
The value of the SWOT data became even more apparent when combined with information from the DART network. SWOT’s swath told scientists what the wave looked like in the middle of the ocean, while DART buoys anchored the timing and amplitude at key points.
However, discrepancies soon emerged. Two gauges did not line up with tsunami predictions from earlier seismic and geodetic source models. One recorded the waves earlier than expected, and the other recorded them later.
Using an inversion technique that assimilated the DART records, the researchers revised their understanding of the earthquake rupture. They concluded the rupture extended farther south and spanned roughly 249 miles (400 kilometers), not the 186 miles (300 kilometers) that many initial models assumed.
Diego Melgar, a study co-author, highlighted the importance of combining data types. “Ever since the 2011 magnitude 9.0 Tohoku-oki earthquake in Japan we realized that the tsunami data had really valuable information for constraining shallow slip,” Melgar said.
Folding that information into standard models is not yet routine. Melgar noted this is because the hydrodynamic models needed to interpret DART data are very different from the seismic wave propagation models used for solid earth data. “But as shown here again, it is really important we mix as many types of data as possible,” he argued.
Historical Context and Future Implications
The Kuril-Kamchatka margin has a long and violent history of producing ocean-wide tsunamis. A magnitude 9.0 quake in 1952 helped motivate the creation of the Pacific’s international alert system, which issued basin-scale warnings during the 2025 event.
The study compared the 2025 event to the 1952 disaster and found that the 2025 earthquake likely re-ruptured significant portions of the megathrust that broke in 1952. However, it occurred farther down-dip, meaning it happened deeper in the earth, and involved little to no near-trench slip. This difference in rupture depth is consistent with the smaller tsunami impact observed in 2025 compared to the catastrophic waves of 1952.
SWOT’s pass adds a new, powerful kind of evidence to the tsunami warning toolbox. With enough luck and coordination, scientists could use similar swaths to validate and improve real-time models in the future.
This will be especially important if dispersion turns out to shape near-coast impacts more than current thought suggests. “With some luck maybe one day results like ours can be used to justify why these satellite observations are needed for real or near-real time forecasting,” Ruiz-Angulo said.
A Turning Point for Forecasting
Three major takeaways emerge from this groundbreaking research. First, high-resolution satellite altimetry can now see the internal structure of a tsunami in mid-ocean, not just its presence. Second, researchers argue that dispersion, often downplayed for great events, may shape how energy spreads into leading and trailing waves. This could alter run-up timing and the force exerted on harbor structures. Third, combining satellite swaths, DART time series, seismic records, and geodetic deformation gives a far more faithful picture of the earthquake source and its evolution.
For tsunami modelers and hazard planners, the message is equal parts caution and opportunity. The physics now has to catch up with the complexity that SWOT has revealed. Planners need forecasting systems that can merge every available data stream. The waves themselves will not get any simpler, but our ability to predict them can get a lot sharper.
The Essentials
- The SWOT satellite captured the first high-resolution, spaceborne swath of a major tsunami.
- The magnitude 8.8 earthquake struck off the coast of Kamchatka, Russia, on July 29, 2025.
- Imagery revealed complex, braided wave patterns challenging the assumption of non-dispersive wave behavior.
- Researchers revised the earthquake rupture length to 400 kilometers based on combined satellite and buoy data.
- Dispersion may significantly affect how wave energy spreads and impacts coastlines.
- The event re-ruptured portions of the fault involved in the historic 1952 earthquake.