Hong Kong housing affordability takes center stage in 2025
Home ownership in Hong Kong is still out of reach for many. The 2025 edition of Demographia International Housing Affordability, a long running assessment released by the Chapman University Center for Demographics and Policy, finds that out of 95 major housing markets across eight nations, not a single one qualifies as affordable (Q3 2024). Hong Kong again ranks least affordable, with a median multiple of 14.4. That ratio means the typical home costs more than fourteen years of median household income before tax. It is the fourteenth consecutive year the city sits at the top of this ranking.
Demographia uses a straightforward metric. It compares the median home price with the median household income to produce a price to income ratio known as the median multiple. Markets rated at 9.0 or higher fall into the category Demographia labels impossibly unaffordable. There are now twelve of these markets worldwide. At the other end of the scale, Pittsburgh is the most affordable major market at 3.2, which still counts as moderately unaffordable under the report’s categories. Hong Kong’s ratio has eased from 16.7 last year and 20.8 before the pandemic in 2019, a change driven by softer prices and a gradual recovery in incomes. Even with that shift, the gap between what homes cost and what households earn remains wide.
How the ranking works and what the numbers mean
Each market in the study aligns with a labor market or commuting shed, not just a city core. That approach lets analysts compare how far a typical household can stretch a paycheck relative to local house prices. It also explains why national averages can mislead. Within one country, a metro with a flexible land market can look very different from a metro with strict limits on expansion.
What is the median multiple
For example, if the median home sells for 300,000 and the pre tax median household income is 75,000, the median multiple is 4.0. Using this method, the report classifies markets along a spectrum, from affordable at 3.0 or less to impossibly unaffordable at 9.0 or more.
As incomes and prices change, so does the ratio. A decline in house prices or an increase in household earnings can lower the multiple, even if mortgage payments still feel heavy. This helps explain why Hong Kong’s ratio has improved yet home buyers continue to face steep barriers.
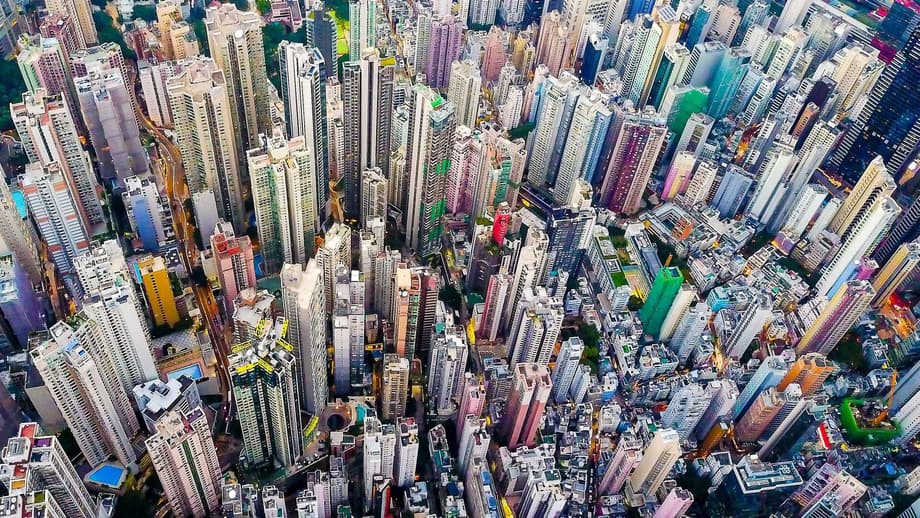
Why Hong Kong remains so expensive
In Hong Kong, scarcity of developable land, decades of tight control over land release, and persistent demand keep prices high. Much of the territory is mountainous or preserved as country parks, and the urban footprint is compact. Households compete for limited space, while local and overseas capital seek property as a store of value. The balance of supply and demand has rarely favored first time buyers.
The land system adds another layer. The government owns all land and controls supply through leasehold sales to developers. Land revenue funds a large share of public services, which gives officials a fiscal incentive to manage supply carefully. Planning rules and height limits in some districts constrain new stock. Research linked to the Demographia study argues that urban containment strategies, such as growth boundaries and green belts, create artificial scarcity and push up land values near regulatory lines.
Price momentum has softened. By the first quarter of 2025, the official price index had fallen by about 7.8 percent year over year, marking a thirteenth straight quarter of annual declines. Completions surged by more than 75 percent in 2024, primary market sales jumped by more than a third, and secondary transactions also rose. The government removed several buyer stamp duties and relaxed mortgage stress tests to revive demand. Average gross rental yields ticked up to around 3.9 percent late last year. Even with these shifts, affordability remains a hurdle for many households.
Joel Kotkin, director of the Center for Demographics and Policy at Chapman University, argues that planning choices play a central role in the price puzzle.
“These high prices are largely the product of policies that seek to limit growth on the periphery, which has been the usual way that cities have grown.”
That critique resonates in land constrained markets like Hong Kong, where any added restriction on new peripheral supply can ripple through the entire price structure.
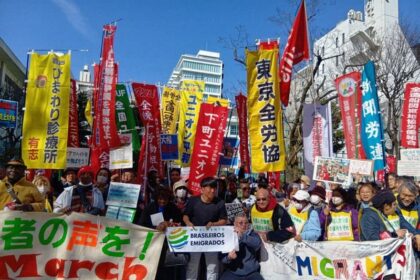
Life on the ground: crowded homes and a warming city
Behind the ratios are daily living conditions that are increasingly difficult. An estimated 220,000 residents live in subdivided units, cage homes or rooftop structures. Many are small, windowless or poorly ventilated. Shared bathrooms and kitchens are common. In the hottest months, thin walls and tin roofs trap heat well into the night, making sleep difficult and adding health risks for older residents and children.
Sze Lai Shan, deputy director at the Society for Community Organization, supports low income households across the city. She has documented living conditions in these units for years.
“Some of the conditions are quite inhumane.”
Heat adds to the strain. The Hong Kong Observatory reported a record number of very hot days in 2024, with 52 days reaching 33 degrees Celsius or above. Surveys of residents in subdivided flats point to widespread sleep problems, skin conditions, dizziness and emotional stress during summer. Community workers describe families rationing meals to keep air conditioners running and older residents spending daytime hours in libraries to stay cool.
Are reforms and mega projects enough
The government has flagged two mega projects as future supply engines. The Northern Metropolis plan, near the Shenzhen border, aims to create a new urban cluster with more than 900,000 homes, integrated transport and new employment centers. Lantau Vision Tomorrow proposes building artificial islands to host more than 200,000 homes. Both could reshape the map over time, yet costs, engineering challenges and long construction horizons mean they will not ease near term pressure.
Policymakers have also moved on shorter time frames. Authorities target about 30,000 light public housing units by 2027 to 2028 and have lined up more than 21,000 transitional units. A pickup in construction completions and an easing of mortgage constraints point to more activity. The critical test is whether new supply matches what buyers can afford, not just how many units are delivered.
Wendell Cox, the author of the Demographia study, cautions that density alone cannot bridge the gap for typical families if the cost of land remains high and fringe supply is blocked.
David Leis, president of the Frontier Centre for Public Policy, argues that the affordability squeeze is central to the larger cost of living story.
“The deterioration of affordable housing has been the principal driver of the present cost of living crisis affecting the middle and working classes.”
Public housing policy also comes under scrutiny. Michael Wong, an economics professor at the University of Hong Kong, has criticized retention rules and the slow turnover of subsidized flats, arguing that this traps new applicants in the private rental market.
“This is purely a failure of public housing policy.”
Tackling affordability at scale will require a mix of land release, infrastructure, faster public housing delivery, and a pipeline of private homes priced for typical earners.
How Hong Kong compares with other cities
Hong Kong shares the top of the least affordable table with Sydney and a string of West Coast markets in North America. These cities combine high demand with geographic or regulatory limits on outward growth. Several of them have ratios above ten, a threshold that signals an extreme squeeze for buyers.
- Hong Kong 14.4
- Sydney 13.8
- San Jose 12.1
- Vancouver 11.8
- Los Angeles 11.2
- Adelaide 10.9
- Honolulu 10.8
- San Francisco 10.0
- Melbourne 9.7
- San Diego 9.5
At the other end, Pittsburgh sits at 3.2, the lowest among the 95 markets reviewed. That still does not meet the affordable definition of 3.0 or below. For the first time in the two decade history of the survey, no major market meets that threshold.
Affordability vs attainability in Asia Pacific
Different yardsticks point to the same pressure. ULI’s Asia Pacific Home Attainability Index defines attainable purchase at five times median household income or less. By that measure, Hong Kong apartments are about 23.4 times median income, the worst score in the region in 2024. On the rental side, a separate global study by DWS estimates that Hong Kong households spend about 61 percent of disposable income to rent a typical two bedroom unit, one of the highest burdens worldwide. The picture is mixed across the region. Singapore’s public housing model keeps purchase costs for many HDB flats within reach of typical incomes, and Tokyo’s large rental stock holds average rent near 17 percent of income in its core wards. Yet in the largest business hubs, buying a home remains out of reach for most young families.
The Bottom Line
- Hong Kong again ranks least affordable with a median multiple of 14.4 in the 2025 edition of Demographia International Housing Affordability (Q3 2024).
- No market among the 95 studied qualifies as affordable, and 12 are rated impossibly unaffordable.
- Hong Kong’s ratio has fallen from 16.7 last year and 20.8 in 2019, helped by declining prices and more new completions, yet the gap for buyers remains large.
- Northern Metropolis and Lantau Vision Tomorrow could add more than 1.1 million homes over time, but they will not provide near term relief.
- Short term measures include removal of extra stamp duties, relaxed mortgage stress tests, and plans for about 30,000 light public housing units by 2027 to 2028.
- Rental pressure is intense, with one study estimating rent at about 61 percent of median household disposable income in Hong Kong.
- Extreme heat and subdivided flats compound the strain on low income households.
- Experts point to land release, planning rules and infrastructure as key levers to improve affordability at prices typical families can pay.