Bhutan’s Urban-Rural Divide: Key Findings from the 2025 Household Consumption and Expenditure Survey
The latest Household Consumption and Expenditure Survey (HCES) 2025, released by Bhutan’s National Statistics Bureau (NSB), offers a revealing snapshot of how Bhutanese households spend their money—and highlights a widening gap between urban and rural communities. The survey, the first of its kind in Bhutan and based on the international COICOP 2018 framework, provides critical data for policymakers, economists, and the public as the country charts its path toward becoming a high-income Gross National Happiness (GNH) economy by 2034.
- Bhutan’s Urban-Rural Divide: Key Findings from the 2025 Household Consumption and Expenditure Survey
- How Much Do Bhutanese Households Spend?
- What Drives the Urban-Rural Spending Gap?
- Food vs. Non-Food: How Bhutanese Prioritize Their Budgets
- Housing, Utilities, and the Digital Divide
- Transport, Education, and Health: Urban Lifestyles Lead the Way
- Special Occasions, Culture, and Spirituality
- Implications for Policy and Development
- In Summary
Drawing on responses from 5,883 households across all 20 dzongkhags (districts), the HCES 2025 represents 159,808 households and a population of 592,598. The findings underscore not only the economic disparities between urban and rural Bhutan, but also the shifting patterns of consumption, housing, and access to services that are reshaping the nation’s social fabric.
How Much Do Bhutanese Households Spend?
One of the most striking findings of the HCES 2025 is the significant difference in household spending between urban and rural areas. On average, Bhutanese households spend Nu 54,387 per month. However, urban households spend nearly 46% more than their rural counterparts, with an average monthly expenditure of Nu 67,616 compared to Nu 46,331 in rural areas. This gap is even more pronounced when looking at per capita spending: urban residents spend Nu 22,168 per person per month, while rural residents spend Nu 14,550.
At the district level, Thimphu leads with the highest average household expenditure (Nu 73,632), while Trashiyangtse records the lowest (Nu 26,934). Per capita, Paro and Thimphu are nearly tied at the top, with spending just above Nu 24,000, while Trashiyangtse lags far behind at Nu 9,025.
These disparities reflect not only differences in income and cost of living, but also the broader economic transformation underway in Bhutan’s urban centers.
What Drives the Urban-Rural Spending Gap?
The urban-rural divide in Bhutan is shaped by a complex interplay of factors, including income, household size, access to services, and lifestyle differences. The HCES 2025 reveals that urban households are generally smaller (average 3.6 persons) than rural ones (3.8 persons), and that wealthier households tend to be even smaller (2.6 persons in the top quintile versus 4.8 in the lowest). This means that urban and affluent households have more disposable income per person, amplifying the gap in per capita spending.
Income inequality is also stark. The top 20% of households spend an average of Nu 96,998 per month—almost four times the Nu 25,862 spent by the lowest 20%. On a per capita basis, the wealthiest spend over Nu 40,000, compared to just Nu 5,545 among the poorest. This growing inequality is a key concern for policymakers, as it has implications for social cohesion and equitable development.
Food vs. Non-Food: How Bhutanese Prioritize Their Budgets
Food remains a major component of household spending in Bhutan, accounting for 40.5% of total expenditure (Nu 7,069 per capita monthly). However, as income rises, the share of spending devoted to food declines—a pattern observed worldwide and explained by Engel’s Law, which states that as household income increases, the proportion spent on food falls, even if actual food spending rises.
Urban households spend more on food in absolute terms (Nu 23,728 per household; Nu 9,126 per capita) than rural households (Nu 17,194 per household; Nu 5,816 per capita), but food makes up a smaller share of their overall budget. Wealthier households allocate just 34.9% of their spending to food, compared to 49.1% among the poorest.
Within food spending, cereals and cereal products dominate (21.4%), followed by dairy and oils (19.5%), vegetables (15.5%), and meat/fish (12.9%). Rural households spend a larger share on staples like cereals, while urban consumers invest more in protein-rich foods such as meat and dairy. Regional dietary preferences and economic conditions also play a role: for example, cereal expenditure varies dramatically by district, from Nu 10,371 in Trongsa to Nu 2,811 in Samdrupjongkhar.
Non-food spending, which includes housing, utilities, transport, education, and health, accounts for 59.5% of total expenditure (Nu 10,365 per capita monthly). Urban households spend significantly more on non-food items (Nu 40,299 per household; Nu 13,042 per capita) than rural households (Nu 27,583; Nu 8,735 per capita). This reflects differences in lifestyle, access to services, and consumption priorities.
Housing, Utilities, and the Digital Divide
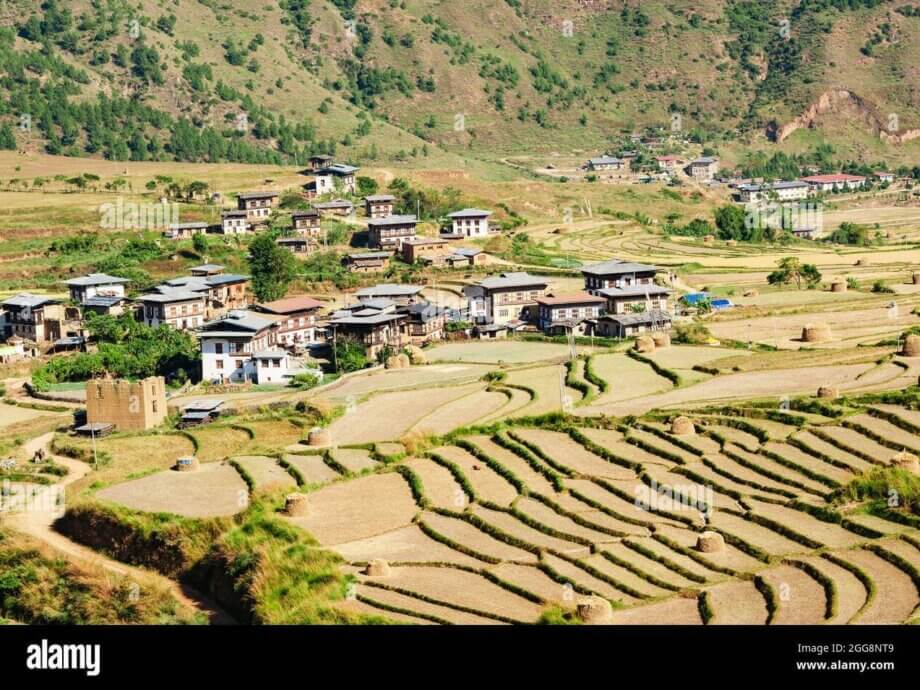
Housing is a major driver of non-food expenditure, especially in urban areas. Nearly 67% of urban households live in apartments, compared to over 82% of rural households who reside in standalone houses. Home ownership is much higher in rural areas (75.8%) than in urban centers (16%), reflecting both cultural traditions and the realities of urban real estate markets.
Urban housing costs are substantially higher, averaging Nu 9,283 per month, with Thimphu and Phuentsholing reporting the highest expenses. In contrast, rural households face higher property maintenance costs but benefit from greater rates of home ownership.
Access to electricity is nearly universal (99.6%), and both electricity and LPG are the dominant cooking fuels nationwide. However, urban households spend more on electricity, while rural families rely more on fuelwood, highlighting ongoing infrastructure gaps.
The digital divide is another area of concern. Urban households spend nearly double the rural average on information and communication technology (ICT), including software and mobile data. This gap in digital access and spending has implications for education, employment, and social inclusion, especially as Bhutan continues to modernize.
Transport, Education, and Health: Urban Lifestyles Lead the Way
Transport is a growing expense, particularly in urban areas. Urban households spend more on vehicle purchases and public transport, with Thimphu Thromde reporting transport spending as high as Nu 73,035 monthly. Rural families, on the other hand, spend more on maintaining and operating their vehicles, reflecting differences in mobility needs and infrastructure.
Education spending is nearly double in urban households compared to rural ones, with tertiary education accounting for almost half of all education-related expenses. This reflects both greater access to educational institutions in urban centers and the higher aspirations of urban families.
Healthcare spending is also higher in urban areas, where households have better access to medical facilities and services. Rural households rely more on medications and traditional healing practices. Notably, women-headed households spend more on health, education, ICT, and personal care, highlighting the role of gender in shaping consumption priorities.
Special Occasions, Culture, and Spirituality
Bhutanese households also allocate significant resources to special family occasions, cultural activities, and spiritual travel (neykor). The national average monthly spending on neykor is Nu 4,072, with female-headed households leading in cultural and religious travel. Rural families spend more on garden and pet care, while urban households invest more in recreational services.
These spending patterns reflect the enduring importance of tradition, community, and spirituality in Bhutanese life, even as the country undergoes rapid economic and social change.
Implications for Policy and Development
The HCES 2025 is more than just a statistical exercise—it is a vital tool for evidence-based policymaking. By providing detailed data on how Bhutanese households allocate their resources, the survey informs the calculation of GDP, updates the Consumer Price Index (CPI), and helps the government design targeted interventions to address inequality and promote inclusive growth.
Sonam Tobgay, Deputy Chief Statistical Officer of the NSB, emphasizes the importance of regular surveys:
“Regular household consumption and expenditure survey will lead to better household consumption estimate for better GDP, which is one of the major components of GDP by expenditure.”
As Bhutan aims to become a high-income GNH economy by 2034, tracking changes in household consumption and expenditure will be critical for measuring progress and ensuring that growth benefits all segments of society.
In Summary
- Urban households in Bhutan spend nearly 46% more per month than rural households, with significant disparities in both total and per capita expenditure.
- Income inequality is growing, with the wealthiest households spending up to seven times more per person than the poorest.
- Food accounts for 40.5% of household spending, but its share declines as income rises; urban households spend more on protein-rich foods, while rural households focus on staples.
- Non-food spending, especially on housing, utilities, transport, and ICT, is much higher in urban areas, reflecting differences in lifestyle and access to services.
- Home ownership is far more common in rural areas, while urban households face higher housing costs and are more likely to live in apartments.
- The digital divide persists, with urban households spending more on technology and connectivity.
- Education and healthcare spending are higher in urban areas, and women-headed households prioritize health, education, and personal care.
- Spending on cultural and spiritual activities remains significant, reflecting Bhutan’s unique social values.
- The HCES 2025 provides essential data for policymakers as Bhutan pursues inclusive, evidence-based development.


