
Access has expanded faster than safety
Nepal has brought drinking water onto the premises of 90% of its population and expanded access to improved toilets to 92.8%. Yet only 47.5% of people receive safely managed drinking water, while 39.9% receive safely managed sanitation, according to the National Statistics Office's Water Supply and Sanitation Situation in Nepal report.
Contents
- Access has expanded faster than safety
- What makes a water or sanitation service safe?
- Contamination rises between the source and the home
- Older surveys show how wealth shapes exposure
- Arsenic adds a different kind of danger
- Why toilets have not closed the sanitation gap
- Geography changes the service people receive
- Changing supplies still leave women carrying water
- Local governments need staff as well as investment
- Key Points
The gap is especially stark in Kathmandu Valley. Improved toilets reach 99.4% of the population, but safely managed sanitation reaches just 14.3%. The report identifies insufficient sewage treatment as a central problem: waste leaves toilets without completing the collection and treatment process needed to protect public health.
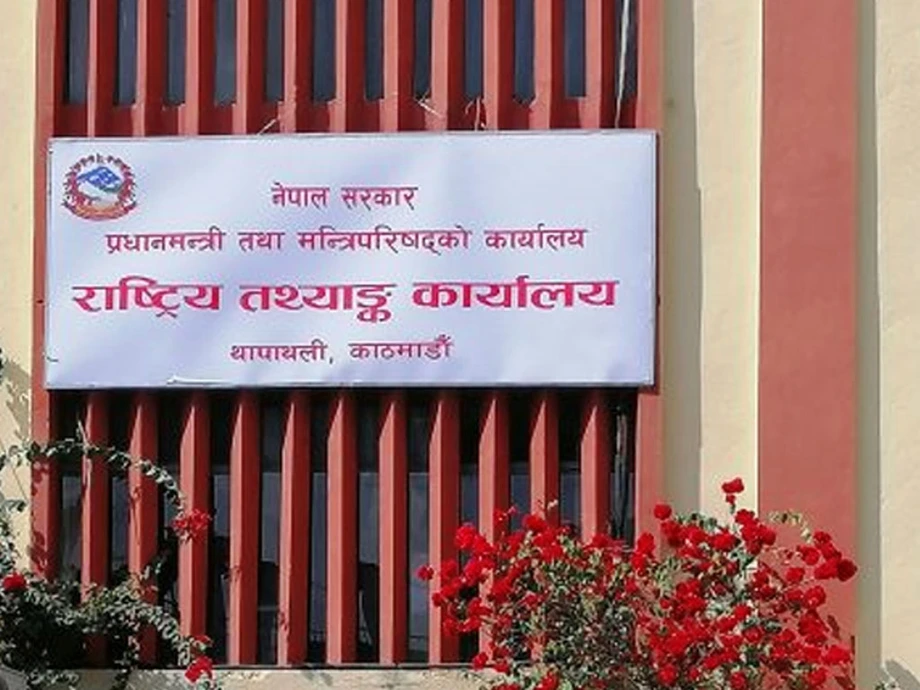
The WASH Situation Report 2026, released in Lalitpur, examines all 753 local government units. WASH means water, sanitation and hygiene. Its findings point toward a change in spending priorities, from counting new taps and toilets to maintaining water systems, testing supplies and safely managing human waste.
For households, the difference is practical. A nearby tap saves time, but families also need water that arrives when required and is free of dangerous contamination. A toilet provides privacy, but communities need the waste it produces to remain safely contained or reach a working treatment facility.
The office built its local indicators using the 2021 national census and the Nepal Multiple Indicator Cluster Survey 2024/25. Officials checked the reliability of the results through field verification in 20 local governments. The assessment therefore brings together household conditions and local service gaps, rather than relying on construction totals alone.
What makes a water or sanitation service safe?
UNICEF's 2019 WASH snapshot sets out three requirements for safely managed drinking water: it comes from an improved source, is available on the premises when needed, and is free of fecal and priority chemical contamination. Improved sources include infrastructure designed to protect water, such as piped supplies and protected wells.
Safely managed sanitation requires an improved toilet that is not shared with other households, together with safe waste disposal. Waste can be safely contained and managed where the toilet stands, or transported elsewhere for treatment. Connecting a toilet to a sewer is only one stage in that process.
The distinction helps explain Nepal's figures. Water on the premises reaches 90%, while safely managed water reaches 47.5%, a difference of 42.5 percentage points. Improved toilet access and safely managed sanitation are separated by 52.9 percentage points, using the report's figures of 92.8% and 39.9%.
At the report's launch, officials also presented a figure of 62.5% of households for improved drinking water access and safe management. The definition behind that combined figure was not explained in the launch details. The report's 47.5% figure refers specifically to the population receiving safely managed drinking water.
Contamination rises between the source and the home
E. coli contamination affects 46.1% of water sources in the new assessment, rising to 61.2% in water stored at home. E. coli is a bacterium associated with feces from people and animals. Its presence in drinking water signals that fecal contamination has entered the supply.
Household water has a contamination rate 15.1 percentage points higher than source water. The gap is larger for tube wells: contamination rises from 26.6% at the source to 59% in stored household water, an increase of 32.4 percentage points. Storage containers, handling and the journey from collection to consumption are therefore important parts of water safety.
Research using the 2014 Nepal Multiple Indicator Cluster Survey documented a similar pattern years earlier. Pragya Kandel, Ritu Kunwar, Prabhat Lamichhane and Surendra Karki examined valid household water tests from 1,421 households and source water tests from 474 households in their household contamination study.
The researchers detected fecal contamination in 82% of household samples and 71.6% of source samples. High or very high contamination levels affected 56.8% of household samples. Water served by households was collected as a glass that would be given to a child to drink, bringing the testing close to the point of consumption.
Kandel and her fellow researchers described their recommended focus in the study's conclusion:
Future public health actions should focus on improving the water quality at the source and minimizing further contamination at households.
Older surveys show how wealth shapes exposure
The 2014 analysis found contamination in 81.2% of household samples supplied by improved sources and 89.6% supplied by unimproved sources. Households reporting boiling, or boiling together with filtration, had lower odds of contamination after the researchers accounted for other measured household characteristics. Having soap and water at a handwashing place was also associated with lower contamination odds.
Household wealth was closely connected to water quality. UNICEF's 2019 snapshot found E. coli contamination in household water among 96% of the poorest households, compared with 65% of the richest. Even among the richest households, only 26% had safely managed drinking water.
The snapshot recorded national safely managed drinking water coverage of 19% in 2019 and safely managed sanitation of 61.1%. Those earlier estimates used that survey's measures and information on waste management. UNICEF explained that calculating safe management for waste transported away from households required further information about transport and treatment.
The 2026 assessment draws on a different combination of census and survey data. A comparison across the two publications needs matching definitions and treatment information. Both identify the same practical need: water quality and waste management must be measured alongside access to infrastructure.
Arsenic adds a different kind of danger
Arsenic contamination affects 3.9% of drinking water sources nationally in the new report. The reported share reaches 9.5% in the Tarai and Madhesh area and 8.4% in Sudurpashchim. Arsenic is a toxic chemical element, and prolonged exposure can cause serious illness.
Bacterial contamination and arsenic require different responses. Boiling can kill disease causing microbes, while dissolved arsenic requires suitable removal technology or a safer water source. Testing is needed to identify which problem a household or water operator faces.
A water quality review published in the International Journal of Environmental Research and Public Health examined 140 studies selected from 3,666 records across seven databases. Bacteria and arsenic were the most prevalent contaminants identified. The review connected contaminated water with health risks including arsenicosis, typhoid, cholera and other waterborne diseases.
Most studies in that review focused on Bagmati Province. The researchers identified limited geographic coverage, inconsistent testing methods, weak enforcement and poor links between water quality monitoring and public health planning. Those gaps matter when local authorities must decide where to test, which supplies need treatment and how to respond to contamination.
Field discussions during verification of the national report also raised concerns about falling groundwater levels in the Tarai and Madhesh. Local planning must address both the amount of water available and its quality.
Why toilets have not closed the sanitation gap
Unsafe collection and treatment of human waste account for about 75% of Nepal's total sanitation service shortfall, according to the national report. The largest remaining task lies beyond toilet construction, in managing what happens after a toilet is used.
Kathmandu Valley illustrates the problem most sharply. Its 99.4% access to improved toilets sits alongside 14.3% access to safely managed sanitation, a gap of 85.1 percentage points. For residents, adequate sanitation depends on treatment capacity and functioning waste services across the surrounding settlement.
Nepal declared itself free of open defecation in 2019. Survey figures nevertheless put open defecation at 5% that year and 5.5% in 2024/25. Maintaining access and use remains a task even after a national declaration.
The longer history shows substantial construction progress:
- 2001: 53.2% of households had no toilet.
- 2011: The share without a toilet fell to 38.4%.
- 2019: Nepal declared itself free of open defecation; the survey recorded open defecation at 5%.
- 2021: Households without a toilet fell to 4.5%.
- 2024/25: Open defecation was recorded at 5.5%.
Households without toilets fell by 48.7 percentage points between 2001 and 2021. The next stage requires services that keep facilities usable and manage waste safely, whether through local containment or collection and treatment.
Geography changes the service people receive
Madhesh has safely managed drinking water coverage of 66.1%, compared with 22.1% in Karnali. That is a gap of 44 percentage points. Across geographic regions, coverage stands at 24% in mountain areas and 33.1% in hill areas.
The immediate causes of water shortages also vary. In Bagmati, damaged or nonoperational infrastructure accounts for 54.1% of reported water unavailability. In Karnali, Lumbini and Madhesh, reaching a water source is the principal difficulty identified by the report.
Repairing an existing system therefore has particular value where infrastructure failure interrupts supply. Places where residents cannot reach a source need a different response, involving access to a suitable supply. The local assessment gives governments a basis for choosing between those needs.
Across South Asia, the report places Nepal's safely managed drinking water coverage of 47.5% below India at 76.4%, Bhutan at 65.6% and Bangladesh at 59.1%. Sri Lanka stands at 46.9% and Pakistan at 45%.
For safely managed sanitation, Nepal's 39.9% trails India at 62.8% and Bhutan at 49.5%, while exceeding Bangladesh at 37.3%. India leads Nepal by 28.9 percentage points on water and 22.9 points on sanitation in these comparisons.
Changing supplies still leave women carrying water
Piped or tap water became more common between the 2011 and 2021 censuses, increasing from 47.8% to 57% of households. Tube well and handpump use fell from 35.1% to 29.8%, while use of unimproved sources, including unprotected wells and rivers, fell from 14.6% to 7.1%.
Jarred and bottled water accounted for 4.6% of households, with 84.6% of those households concentrated in Kathmandu Valley. The figures show how strongly this form of supply is clustered in the capital region.
Women and children still account for more than 80% of people responsible for collecting water, according to the national report. Women aged 25 to 49 account for 44% alone. Where water remains distant or unreliable, collecting it continues to claim time from the same groups.
UNICEF's 2019 snapshot recorded women and girls as responsible for water collection in 82% of households. It also found that 60% of households spent less than 30 minutes each day collecting water.
Hygiene indicators offer evidence of progress. The new assessment records the share washing with soap and water rising from 80.7% in 2019 to 86.4% in 2024/25. UNICEF's 2019 snapshot also found that 83% of menstruating women aged 15 to 49 had appropriate materials and a private place to wash and change at home, showing another dimension of household hygiene and privacy.
Local governments need staff as well as investment
Nepal's national water and sanitation information system, NWASH MIS, indicates insufficient technical staffing across all 753 local governments. Operating water systems and managing sanitation require people who can maintain equipment, assess faults, monitor quality and oversee treatment.
The report divides local governments into four groups: 57 facing a severe crisis in both water and sanitation, 277 at risk in water services, 147 at risk in sanitation, and 272 classed as comparatively progressive and sustainable. The first three groups together contain 481 local governments, about 64% of the total.
Chief Statistician Laxmi Basnet said the findings could help set priorities for water and sanitation development. The National Statistics Office called for ministries and agencies to direct policy and investment toward areas with weaker conditions.
The report recommends changing how money is spent: repair and restore existing infrastructure alongside building new facilities. Combined with the research findings, that means testing water across more places, protecting supplies through delivery and household storage, and ensuring that collected waste reaches safe treatment.
Nepal has already demonstrated its ability to expand physical access. The task now is to make those facilities deliver dependable water and sanitation services, especially in local governments where the assessment identifies the greatest need.
Key Points
- Safely managed drinking water reaches 47.5% of Nepal's population, while safely managed sanitation reaches 39.9%.
- E. coli contamination rises from 46.1% at water sources to 61.2% in stored household water.
- Unsafe waste collection and treatment account for about 75% of the sanitation service shortfall.
- Kathmandu Valley has 99.4% access to improved toilets but only 14.3% access to safely managed sanitation.
- The assessment covers all 753 local governments and identifies 57 facing a severe crisis in both water and sanitation.
- The report recommends greater attention to maintenance, restoration and investment in places with weaker services.