
Severe air spreads beyond the capital
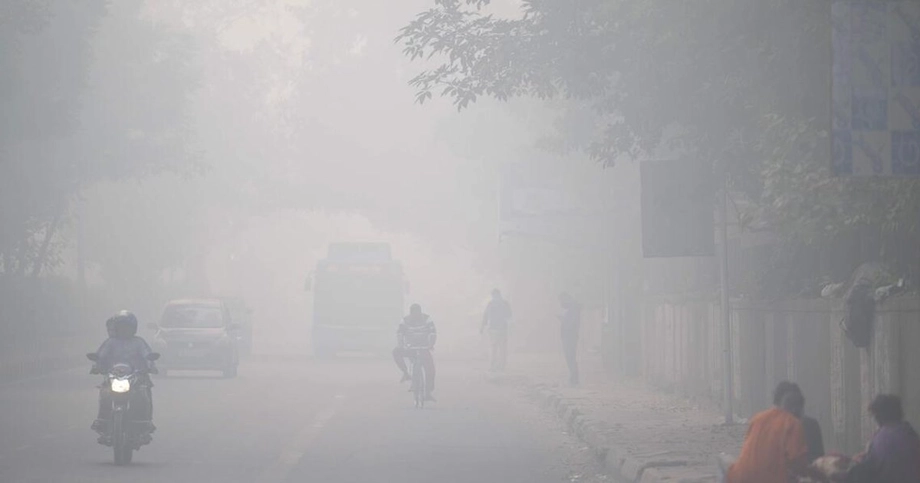
Delhi recorded an Air Quality Index of 403 on Friday morning, entering India's severe category as dense smog obscured roads and street lights across the capital of about 20 million people. The reading was 82 points higher than 24 hours earlier, while one monitoring station, at IIT Delhi, reached 488.
Contents
- Severe air spreads beyond the capital
- Why Delhi has two different AQI readings
- Pollution hotspots across Delhi and its neighbours
- How winter weather traps the pollution
- What was contributing to the dirty air?
- The emergency response and its timing
- Hospitals report more breathing problems
- Lahore's lower ranking still leaves dangerous exposure
- Delhi's audit identified problems before this episode
- Key Points
Swiss monitoring company IQAir placed Delhi above Lahore as the world's most polluted major city with a reading of 334, classed as hazardous on its scale. India's Central Pollution Control Board (CPCB) uses a different calculation system, explaining why its number was higher. Both readings pointed to dangerous conditions for people breathing the city's air.
Ballabhgarh in neighbouring Haryana recorded an even higher Indian AQI of 419. All 10 cities in a regional comparison had readings above 300, showing that the pollution extended across Delhi's borders into surrounding parts of Haryana and Uttar Pradesh.
Hospitals were already reporting more patients. Fortis hospitals in Delhi recorded increases of 7% to 10% in outpatient visits and 5% to 7% in admissions over the preceding three to four days, according to Dr Avi Kumar, who heads pulmonary medicine at Fortis Escorts.
The episode brings together several problems: continuing emissions, winter weather that prevents dirty air from escaping, restrictions affecting transport and construction, and weaknesses in monitoring and enforcement documented by government auditors. Lahore's experience adds another warning: pollution can improve compared with a previous year while still exceeding health standards every day measured.
Why Delhi has two different AQI readings
An AQI turns measurements of air pollution into a number that people can use to understand health risks. The number depends on the pollutants measured, the period covered and the rules used to convert concentrations into an index.
India's system covers eight pollutants, including fine particles, larger dust particles, nitrogen dioxide, ozone and carbon monoxide. Each pollutant receives its own score. The highest score determines a monitoring station's AQI, rather than an average of all pollutant scores.
CPCB generally uses averages covering 24 hours for PM2.5 and PM10, the two main categories of airborne particles. Delhi's city reading then averages the AQI values from stations reporting data. Neighbouring cities receive separate readings.
IQAir uses the United States AQI scale, which covers six pollutants. Its AQI Plus calculation relies mainly on hourly measurements and uses the median, or middle reading, across monitoring stations. Its network includes government instruments and sensors costing less than conventional monitoring equipment.
IQAir adopted revised American standards in May 2024, reducing the upper PM2.5 concentration for its good category from 12 to 9 micrograms per cubic metre. Different thresholds and averaging periods mean the same air can produce different numbers, with hourly readings responding faster when conditions change.
India classifies AQI readings of 301 to 400 as very poor and 401 to 500 as severe. IQAir's hazardous label belongs to its own scale. At 11 a.m. Pakistan time, its Delhi reading had fallen to 208, while Lahore ranked seventh at 155, illustrating how quickly the international ranking can shift.
Pollution hotspots across Delhi and its neighbours
IIT Delhi's AQI of 488 was followed by Chandni Chowk at 479, Delhi University's North Campus at 478 and Pusa at 469. Those local readings were substantially higher than Delhi's city average of 403.
CPCB figures showed severe pollution at more than half the reporting stations. PM2.5 was the leading pollutant at 48 of 58 monitoring stations in the cited breakdown.
Outside Delhi, Ghaziabad recorded 379, Noida 368, Khora 358 and Greater Noida 356. Gurugram and Manesar stood at 351 and 350, while Panchgaon recorded 346 and Bahadurgarh 323. Ballabhgarh and Delhi were in the severe category; the other eight cities were in the very poor category.
Video footage showed cars and motorcycles emerging from thick smog on Delhi's main roads, with street lights partly obscured. Reduced visibility added difficulty to journeys through a region where residents routinely cross municipal and state boundaries for work.
How winter weather traps the pollution
Delhi's atmospheric mixing layer, the depth of air through which pollution can circulate vertically, fell to around 400 metres on November 12 from approximately 1,400 metres two days earlier, according to figures attributed to official weather and pollution data.
That was a reduction of about 71% in mixing height. Emissions were entering a much shallower layer of air, allowing pollution to build up near the ground.
A temperature inversion helps explain this process. Normally, warmer air near the surface can rise and carry pollutants upwards. During an inversion, colder air sits beneath a warmer layer that acts like a lid, limiting that movement.
Long winter nights allow the ground to cool. Clear skies and calm winds can strengthen the inversion, while fog and moisture further reduce visibility. At Safdarjung, all 11 observations between 8 p.m. and 6:30 a.m. recorded still air during the overnight deterioration.
Delhi's PM2.5 concentration reached 244 micrograms per cubic metre by 6 p.m. on Thursday, more than doubling in 24 hours and reaching about four times the national standard. PM2.5 particles measure no more than 2.5 micrometres across and can travel deep into the lungs.
What was contributing to the dirty air?
Indian Institute of Tropical Meteorology estimates for November 12 assigned 25.4% of Delhi's pollution load to biomass burning and another 25.4% to secondary organic aerosols. Vehicles accounted for 17%.
Secondary organic aerosols are particles that form in the atmosphere when gases undergo chemical reactions. Those gases can come from vehicles, industry and burning vegetation. Their formation connects pollution released at ground level with chemistry happening after emissions enter the air.
The remaining estimated shares were 11.8% for secondary inorganic aerosols, 10.7% for mixed combustion, 7.1% for firecrackers, 1.5% for waste burning, 0.9% for mineral dust and ash, and 0.2% for industrial emissions. The percentages describe that particular period and change with weather, emissions and the movement of polluted air.
Satellite instruments detected 4,107 farm fires in India's Punjab and Haryana from October 1 to November 12, compared with 4,220 during the corresponding previous season. Punjab accounted for 3,729 detections and Haryana for 378; 96 were recorded on November 12.
Fire detection also depends on timing. An analysis using Meteosat measurements found that 98% of the fire heat recorded in 2025 occurred after 3 p.m., compared with 94% in 2024. A satellite passing at about 1:45 p.m. can miss burning later in the afternoon, leaving some agricultural fires outside its daily count.
The emergency response and its timing
The Commission for Air Quality Management invoked Stage III of the Graded Response Action Plan, known as GRAP, across the National Capital Region on November 6. The stage addresses severe conditions associated with AQI readings from 401 to 450 and can be introduced in anticipation of worsening air.
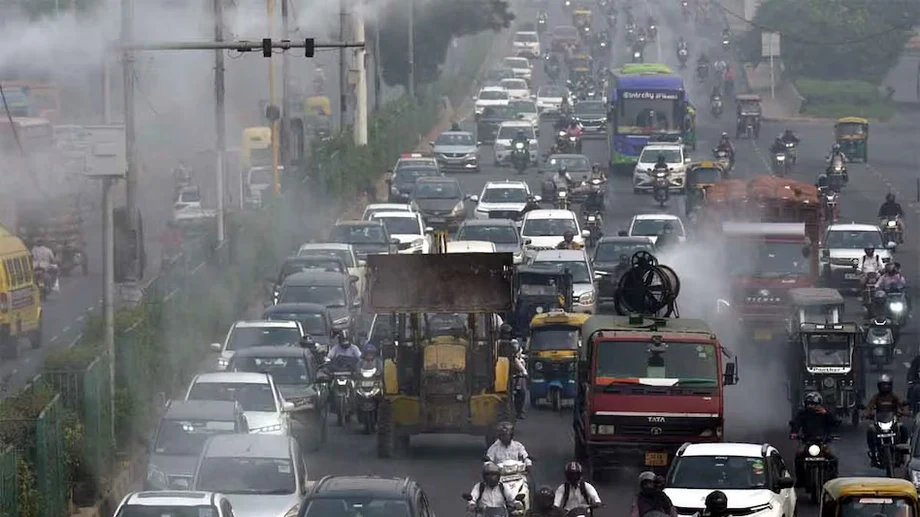
Restrictions include bans on several construction and demolition activities that generate dust, closures of stone crushers and mining operations, and limits on older vehicles. Vehicle measures cover Delhi and specified districts, including Gurugram, Faridabad, Sonipat, Ghaziabad and Gautam Buddha Nagar.
The restrictions target light vehicles meeting BS-III petrol and BS-IV diesel standards or older standards, alongside specified diesel goods vehicles. Bharat Stage, abbreviated as BS, is India's system of vehicle emission standards. Stage IV is the highest GRAP level, associated with an average AQI above 450.
The main developments unfolded over several dates:
- November 1: Delhi introduced its No PUC, No Fuel rule, requiring a valid Pollution Under Control certificate for fuel purchases.
- November 6: CAQM invoked GRAP Stage III across the National Capital Region.
- November 10 to 12: Delhi's mixing layer contracted from approximately 1,400 metres to 400 metres.
- November 12: IITM estimates identified biomass burning, particles formed through atmospheric chemistry and vehicles as major contributors.
- Friday morning: CPCB recorded Delhi's AQI at 403, while IQAir initially placed the city above Lahore.
Construction restrictions interrupt work that creates dust, while vehicle limits change which cars and goods vehicles can operate. Their practical effect depends on inspections and compliance across several jurisdictions sharing the same polluted air.
Hospitals report more breathing problems
Dr Avi Kumar said Fortis hospitals in Delhi had seen more allergies, pneumonia and respiratory infections, including symptoms among people without a previous history of breathing problems. Oxygen requirements rose by 5% to 7%, alongside the increase in admissions.
Dr Tanu Kumar, a paediatrician at a Delhi government hospital, reported nearly a 5% increase in respiratory outpatient cases. Patients included people with asthma, chest infections, prolonged coughs and new wheezing, a whistling sound during breathing. More patients also needed nebulisation, which delivers medicine as a mist.
Dr Girish Sindhwani, head of pulmonary medicine at AIIMS Rishikesh, described risks extending beyond the lungs:
So yes, it affects not only the lungs but also the heart and other organ systems.
Dr Avi Kumar advised urgent medical attention for unusual breathlessness, falling oxygen levels or a fever that does not subside. Older people and patients with asthma were among those doctors identified as particularly vulnerable.
Doctors recommended reducing outdoor exertion during heavy pollution and wearing a properly fitted N95 mask when travel is necessary. Dr Tanu Kumar said an N95 with a proper seal can filter up to 95% of particulate matter. Fit matters because air entering around the edges bypasses the filter.
Dr Sindhwani advised vulnerable residents to avoid early morning walks during winter pollution episodes. He also described air purifiers as devices that work within a limited space, such as one room, with their performance affected by open windows and repeated entry of outdoor air.
Lahore's lower ranking still leaves dangerous exposure
Lahore's improvement in the hourly ranking followed several days when it had occupied the top position. Measurements published by the Pakistan Air Quality Initiative (PAQI) showed an average PM2.5 concentration of 126 micrograms per cubic metre, roughly eight times the World Health Organization's guideline for exposure over 24 hours.
The average was 11% lower than during the corresponding period in 2025. Even with that improvement, Lahore exceeded Pakistan's national standard for PM2.5 over 24 hours on all 40 days with valid data.
PAQI recorded 18,825 satellite fire detections across Pakistan's Punjab, with 89% classified as likely crop residue burning. The daily peak was 1,102 detections on November 1. The estimated contribution of those fires to pollution in individual cities remained uncertain, with stagnant weather and limited atmospheric mixing also affecting concentrations.
Punjab Environment Protection Agency spokesperson Sajjad Bashir said enforcement had intensified against polluting industries, brick kilns, agricultural burning, smoky vehicles and open waste burning. He said favourable weather had helped disperse pollution, while continued enforcement beyond the smog season was needed to sustain improvement.
From January 1 to November 10, brick kiln inspections rose from 37,838 in 2025 to 80,594 in 2026, more than doubling. Authorities demolished 1,372 kilns and sealed 864. Industrial inspections increased from 38,098 to 47,643, with 1,419 units sealed and fines totalling 216.98 million Pakistani rupees.
Restaurant inspections produced another set of changes: 9,802 visits resulted in 3,750 suction hoods being installed and 1,263 establishments being sealed. The campaign shows the range of activities involved in controlling emissions, from major industries to kitchens.
Delhi's audit identified problems before this episode
The Comptroller and Auditor General's Performance Audit on the Prevention and Mitigation of Vehicular Air Pollution in Delhi, Report No. 2 of 2022, was tabled in the Delhi Assembly on April 1, 2025. Its examination extended up to March 2021.
The auditor found poor to severe air on 1,195 of 2,137 days examined, about 56%. It identified weaknesses in monitoring station locations, gaps in pollutant data, unreliable vehicle emission certificates and insufficient public transport.
Delhi had 6,750 buses against an assessed requirement of 9,000, a shortfall of 2,250, or one quarter. Of 657 notified bus routes, 238 were unserved. Those gaps matter when residents are asked to leave older vehicles off the road.
Between January 2017 and March 2020, conditions for odd-even driving restrictions and truck entry curbs arose on 95 occasions. The audit found notifications for the two measures were issued only five and eight times respectively.
Vehicle testing also contained serious errors. Test values were missing for 24% of 2.214 million diesel vehicles checked between August 2015 and August 2020. Another 4,007 diesel vehicles received certificates despite exceeding emission limits, as did 108,000 petrol, CNG and LPG vehicles.
Monitoring difficulties surfaced again during the recent pollution episode. Twelve stations lacked data when Delhi's average AQI was 333 at 7 p.m. Delayed readings for November 9 included PM2.5 concentrations of 3,744 micrograms per cubic metre at Mundka, 3,023 at JNU and 3,008 at NSUT West Campus.
CPCB said its analysers were calibrated only up to 1,000 micrograms per cubic metre and readings beyond that were treated as outside range. Capturing extreme concentrations is therefore part of the monitoring challenge, alongside keeping stations operating consistently.
The Delhi Assembly referred the audit to its Public Accounts Committee and requested Action Taken Notes. A comprehensive public account of implementation by each department was not available. The combination of bus shortages, weaknesses in vehicle testing and gaps in measurements identifies concrete work extending beyond emergency restrictions during a few weeks of smog.
Key Points
- Delhi recorded an official AQI of 403 on Friday morning; IQAir initially ranked it above Lahore with a reading of 334 on a different scale.
- Ballabhgarh recorded 419, and all 10 cities in the regional comparison exceeded 300.
- Delhi's mixing layer fell from about 1,400 metres to 400 metres in two days, limiting the space in which emissions could disperse.
- GRAP Stage III restrictions covered construction, certain older vehicles and specified goods vehicles across the region.
- Delhi hospitals reported increases in respiratory consultations, admissions and oxygen requirements.
- Lahore's average PM2.5 fell 11% compared with the corresponding period in 2025, yet exceeded Pakistan's daily standard on all 40 measured days.
- A government audit identified gaps in Delhi's monitoring, vehicle emission checks, bus services and enforcement.