
Mandir Marg records a sharp rise in fine particle pollution
Fine particle pollution reached 879 micrograms per cubic metre in Delhi's Mandir Marg locality early on November 9, 2026, about eight hours after Diwali fireworks peaked. The reading was 58.6 times the World Health Organization's guideline of 15 micrograms per cubic metre for average exposure over 24 hours.
Contents
- Mandir Marg records a sharp rise in fine particle pollution
- Fireworks continued beyond the permitted hours
- How the restrictions and pollution unfolded
- What the morning readings mean for neighbourhoods
- Missing readings leave gaps in the overnight picture
- An official study recorded similar Diwali surges years earlier
- Fireworks add to several major winter pollution sources
- Residents who work outdoors have fewer ways to escape
- Stage III controls remain in force as severe air is forecast
- Key Points
IQAir, which cited a city government monitoring station, gave the Mandir Marg measurement. Official monitoring data also put concentrations in some parts of Delhi at about 66 times the WHO guideline overnight. Those figures describe different local readings during a night when pollution varied across the capital.
The comparison needs a simple explanation: a reading taken during a pollution spike measures conditions at that time, while the WHO guideline concerns the average across a full day. At Akshardham, for example, the Delhi Pollution Control Committee recorded an hourly PM2.5 concentration of 760.99 micrograms per cubic metre at 11 pm on November 8, roughly 51 times the daily guideline.
PM2.5 means airborne particles measuring 2.5 micrometres or less across. They are small enough to travel deep into the lungs, and exposure can harm breathing and cardiovascular health. Fireworks added another burst of pollution to winter air already affected by traffic, industry and burning vegetation.
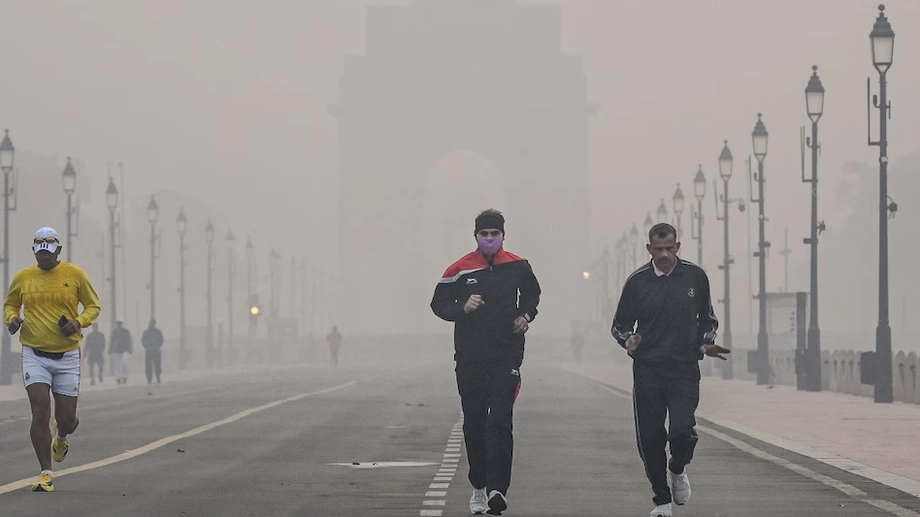
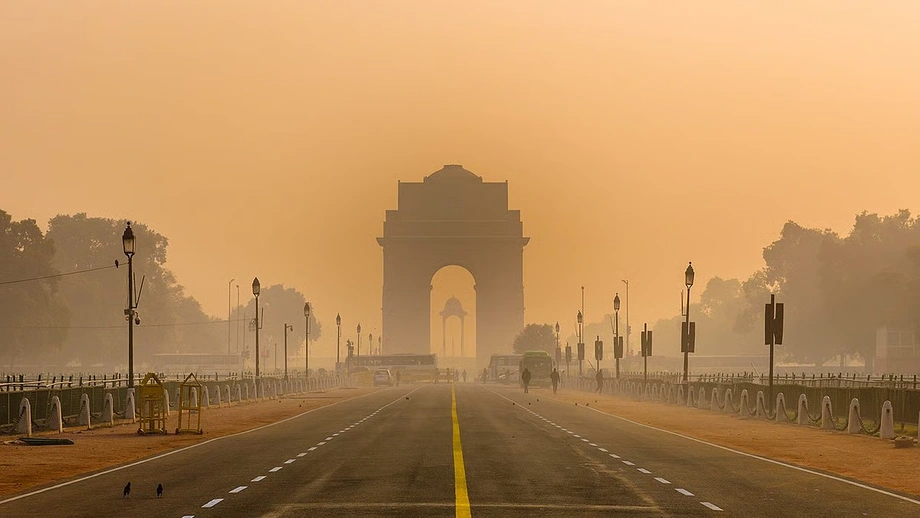
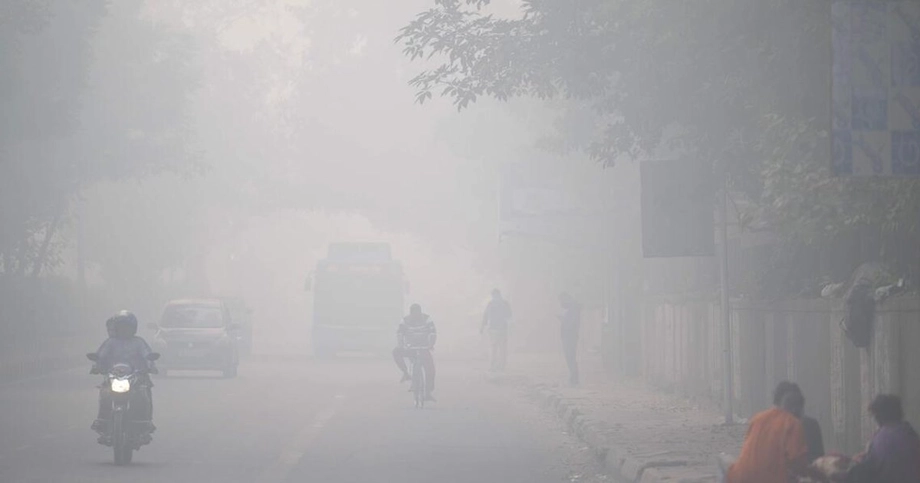
By 7 am, the Central Pollution Control Board's citywide Air Quality Index stood at 368, in the very poor category. Fifteen of 54 monitoring stations with valid readings were in the severe category. Thick grey haze reduced visibility as a metropolitan population of more than 30 million began the day.
Fireworks continued beyond the permitted hours
The Supreme Court had permitted certified green firecrackers during restricted windows on November 7 and 8: from 6 am to 7 am and from 8 pm to 10 pm. These products are designed to produce fewer emissions than conventional firecrackers.
Residents nevertheless continued setting off fireworks after the 10 pm deadline on Diwali night. Fireworks were reported in Pitampura, Burari, Mayur Vihar and parts of Lutyens' Delhi, with activity gathering pace after around 5 pm to 6 pm.
Conventional firecrackers were also reportedly used in several neighbourhoods. For residents breathing the resulting smoke, the practical outcome was another pollution surge even while restrictions on other activities were already in force.
The timing matters because Delhi entered the celebrations with poor air quality. Firecracker emissions arrived on top of an existing pollution burden, while low wind speeds and weak atmospheric ventilation limited how quickly pollutants could disperse.
How the restrictions and pollution unfolded
Delhi's pollution controls were tightened before Diwali. The sequence shows that the overnight spike occurred during an existing response to deteriorating air, rather than at the beginning of the winter pollution episode.
- November 1: Expanded winter controls began, including restrictions on entry by vehicles registered outside Delhi that fall below BS-VI emission standards, subject to exemptions, and enforcement of the No PUC, No Fuel rule.
- November 6: The Commission for Air Quality Management invoked Stage III of the Graded Response Action Plan across Delhi and the National Capital Region.
- November 7 and 8: The Supreme Court permitted certified green firecrackers during limited morning and evening windows.
- November 8: Diwali fireworks continued beyond the 10 pm deadline, followed by sharp increases in fine particle concentrations.
- November 9: Delhi woke to dense haze, very poor citywide air quality and severe readings at multiple monitoring stations.
BS-VI is a vehicle emission standard intended to limit exhaust pollution. PUC means Pollution Under Control, the certification used to check vehicle emissions. These controls address road pollution, while the court's firecracker conditions govern a separate source of smoke.
What the morning readings mean for neighbourhoods
Burari Crossing and Sonia Vihar each recorded an AQI of 441 in the morning data, followed by Vivek Vihar at 437 and Delhi Technological University at 434. North Campus of Delhi University and Jahangirpuri each registered 433, while Rohini recorded 430 and Bawana 424.
The CPCB classifies AQI readings from 301 to 400 as very poor and readings from 401 to 500 as severe. AQI converts measurements of air pollutants into an index that helps people understand the condition of the air. PM2.5 concentrations, by contrast, express the actual mass of fine particles in a cubic metre of air.
All 54 stations with valid data in the morning snapshot recorded AQI above 200, and 50 were above 300. The citywide figure of 368 therefore sat alongside considerably worse conditions in several neighbourhoods.
Pollution extended beyond Delhi's boundaries. Bahadurgarh recorded an AQI of 389, Ghaziabad 366, Noida 340, Manesar 338, Faridabad 334 and Gurugram 316. Greater Noida stood at 293. The spread across the National Capital Region meant residents travelling between nearby cities were still moving through heavily polluted air.
Missing readings leave gaps in the overnight picture
Senior Congress leader Ajay Maken alleged that PM2.5 readings from 25 of Delhi's 39 monitoring stations were missing between 2 am and 3 am on November 9. Citing CPCB data, he said nine stations with readings during that hour averaged 576 micrograms per cubic metre.
Maken's figures put that concentration at 38.4 times the WHO daily guideline. At the same nine stations during the corresponding period on the previous Diwali, the figure was 562 micrograms per cubic metre. The increase of 14 micrograms amounted to about 2.5%.
The reported absence of readings for several hours at multiple Delhi Pollution Control Committee stations also left gaps around the pollution peak. The cause of the missing data, and the status of the five stations left outside Maken's count of 25 missing and nine reporting, was not explained.
Maken's comparison traced a steep evening rise: 141 micrograms per cubic metre at 6 pm, 265 at 8 pm, 403 at 9 pm and 506 at 10 pm. The average reached 610 at midnight before declining to 597 at 1 am and 576 at 2 am.
Those figures show both the rapid buildup and the persistence of pollution after fireworks activity peaked. Even as concentrations declined overnight, the remaining fine particle load was still extremely high.
An official study recorded similar Diwali surges years earlier
The Delhi air pollution study, published on the Delhi environment department's website, documented a recurring festival pattern. Its findings said particulate matter levels during Diwali nearly doubled from average levels, while the organic content of those particles more than doubled.
The study also found that potassium and barium, identified as major firecracker components, could increase about tenfold. Measuring such substances helps researchers examine how the composition of polluted air changes during celebrations, alongside changes in the total amount of particles.
At Rohini on Diwali day, November 3, 2013, PM2.5 reached 655 micrograms per cubic metre and the larger PM10 particle category reached 894. Sulphur dioxide peaked at 28 micrograms per cubic metre, about three times normal values.
Delhi's history therefore includes both large increases in particle concentrations and changes in the chemicals carried by those particles during Diwali. The current episode adds a new set of local measurements to a pattern documented more than a decade earlier.
Fireworks add to several major winter pollution sources
India's environment ministry attributes 23% of Delhi's winter pollution to vehicles, 20% to biomass burning, including farm stubble fires, and about 9% to industry, including power plants burning coal. The largest share in that breakdown, 27%, comes from secondary particles.
Secondary particles form in the atmosphere when gases released by vehicles, industry, power plants and burning vegetation react. Some pollution therefore enters the air as gases and becomes fine particles later, rather than leaving a chimney or exhaust pipe already in particle form.
The older Delhi study used a different set of measurements and categories. Its winter PM2.5 table assigned about 30% to secondary particles, 26% to biomass burning and 25% to vehicles. Industrial emissions and coal and fly ash were listed separately, at about 0.8% and 4.8% respectively.
The official study's site results also showed substantial local variation. Biomass burning accounted for about 34% of winter PM2.5 at Rohini, compared with about 12% at Dilshad Garden. Secondary particles contributed about 20% at Rohini and about 39% at Dilshad Garden.
Wind trajectory analysis in the study showed air frequently travelling over Punjab and Haryana before reaching Delhi from the northwest. The researchers identified crop residue burning after the monsoon as a possible contributor to higher pollution in October and November, and recommended managing those fires alongside stopping biomass burning within Delhi.
Residents who work outdoors have fewer ways to escape
Delhi entrepreneur Saket Sambhav drew attention to the unequal burden of Diwali smoke in a LinkedIn post around 10 pm. He highlighted newborn babies, older people with breathing problems, street vendors and night guards, as well as animals and birds affected by pollution and noise.
Sambhav argued that vendors and guards often have little choice about remaining outdoors and may lack access to air purifiers or an indoor place to retreat. His criticism focused on the human cost of celebrations as much as on the pollution measurements.
Sambhav, describing what he saw as a conflict between spiritual celebration and polluted air, wrote:
True spiritual culture does not require you to poison the very air you breathe,
Very poor air can cause respiratory illness with prolonged exposure. Severe air quality can affect healthy people and can have serious effects on people already living with respiratory or cardiovascular conditions. Those risks make the duration of the pollution episode important, alongside the highest reading reached overnight.
A 2024 study published in The Lancet Planetary Health estimated that 3.8 million deaths across India between 2009 and 2019 were linked to air pollution. That national estimate concerns the cumulative health burden over years, while Delhi's overnight measurements describe a concentrated episode of exposure.
Stage III controls remain in force as severe air is forecast
The Commission for Air Quality Management's Stage III restrictions include a ban on construction and demolition work deemed nonessential, restrictions on certain diesel vehicles and additional controls on industrial and other polluting activities.
Stage III operates alongside measures from the first two stages of the Graded Response Action Plan. Those include intensified road cleaning, water sprinkling, dust controls, higher parking fees and efforts to strengthen public transport. Construction businesses, drivers and industrial operators therefore face restrictions while residents continue to encounter polluted air.
The Air Quality Early Warning System forecast severe conditions from November 9 for the following few days. Low wind speeds and poor ventilation were expected to slow the dispersal of emissions from traffic, industry, stubble burning and fireworks.
Delhi's immediate problem is the combination of a sharp festival surge and a broader winter pollution load. The official study's findings support action on several sources at once: firecracker controls address the celebration period, while vehicle emissions, burning vegetation and the gases that form secondary particles continue to shape the air afterwards.
Key Points
- Mandir Marg recorded PM2.5 of 879 micrograms per cubic metre early on November 9, 2026.
- The figure was 58.6 times the WHO guideline for average exposure over 24 hours; the reported spike and daily guideline cover different measurement periods.
- Fireworks continued beyond the Supreme Court's 10 pm deadline despite limited permission for certified green firecrackers.
- Delhi's AQI stood at 368 at 7 am, with 15 of 54 reporting stations in the severe category.
- Ajay Maken alleged that readings were missing from 25 of 39 stations during a critical overnight hour.
- Stage III pollution restrictions were in force, and severe air quality was forecast for the following few days.