
Delhi's pollution burden reaches far beyond a bad air day
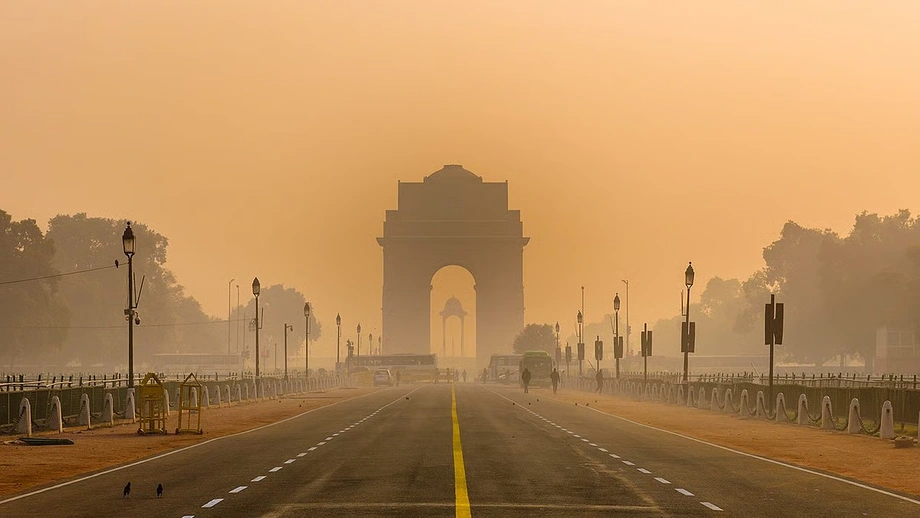
Delhi residents could gain an estimated 8.2 years of average life expectancy if fine particle pollution fell permanently to the World Health Organization's guideline, according to the 2025 Air Quality Life Index. The capital's annual PM2.5 concentration was 88.4 micrograms per cubic metre in 2023, almost 18 times the WHO guideline of 5.
Contents
- Delhi's pollution burden reaches far beyond a bad air day
- What the life expectancy figures mean
- Why the pollution standard changes the answer
- India's exposure exceeds the global average
- How daily air quality categories work
- Delhi and Kolkata show the seasonal divide
- Mumbai and Hyderabad have swung sharply
- Bengaluru and Chennai retain a measurable burden
- Putting the different years in order
- Key Points
The estimate, published by the Energy Policy Institute at the University of Chicago (EPIC), puts a measure of lost lifespan beside a familiar urban problem. Across six major Indian cities, the potential gains from meeting the WHO guideline range from 2.1 years in Bengaluru to 8.2 years in Delhi. Kolkata, Hyderabad, Mumbai and Chennai fall between them.
Daily air quality records show how unevenly cleaner conditions have arrived. Central Pollution Control Board (CPCB) figures covering 2022 through November 4, 2026, show Delhi recorded just three days in the good category in 2022, one in 2023, none in either 2024 or 2025, and one in 2026 up to that date.
Other cities recorded more good days, sometimes many more. Kolkata had 97 in 2025, while Mumbai had 87 by November 4, 2026. Yet all six cities had estimated life expectancy gains of more than two years under the WHO benchmark. The annual pollution estimates and daily records describe two connected parts of the problem: exposure accumulated over years and the changing air residents breathe from day to day.
What the life expectancy figures mean
EPIC's 2025 AQLI report uses pollution data from 2023, including estimates derived from satellites. It translates sustained exposure to fine particles into an estimated effect on average life expectancy, the number of years people in a population can expect to live.
The methodology in the 2025 AQLI Annual Update combines population-weighted annual-average satellite estimates of PM2.5, excluding sea salt and mineral dust, with a relationship derived from two peer-reviewed studies, Chen et al. (2013) and Ebenstein et al. (2017). Those studies used differences in long-term pollution exposure in China to isolate its effect on life expectancy. The AQLI applies an estimated loss of 0.98 years of life expectancy for each additional 10 micrograms per cubic metre of sustained PM2.5 exposure, assuming a linear relationship. The satellite data come from the Atmospheric Composition Analysis Group at Washington University in St. Louis, with population data from LandScan. This method underlies the city and national estimates.
The city estimates describe the potential benefit of bringing pollution down permanently to the WHO guideline. For a population, a gain in average life expectancy means longer lives on average, with individual outcomes varying according to health, age, exposure and other circumstances.
The estimated gains for the six cities are:
- Delhi: 8.2 years.
- Kolkata: 4.1 years.
- Hyderabad: 3.2 years.
- Mumbai: 3.1 years.
- Chennai: 2.2 years.
- Bengaluru: 2.1 years.
Delhi's estimated gain is exactly twice Kolkata's, 8.2 years compared with 4.1. Even Bengaluru, which has the smallest figure among these six cities, has an estimated gain exceeding two years. Cleaner air therefore offers a substantial potential benefit across the entire group, although the size of that benefit varies sharply.
Why the pollution standard changes the answer
Delhi's figures also show how much the chosen pollution benchmark matters. The WHO guideline for annual average PM2.5 is 5 micrograms per cubic metre, while India's national annual standard is 40. India's threshold is eight times the WHO guideline.
At Delhi's 2023 concentration of 88.4, the city was exposed to about 2.2 times the national standard. EPIC estimates that bringing pollution down to India's standard would add 4.7 years to average life expectancy. Reaching the WHO guideline would raise that estimated gain to 8.2 years.
The report's methodology supports the national-standard estimate: reducing Delhi's concentration from 88.4 to 40 micrograms per cubic metre means a sustained reduction of 48.4. Multiplying that reduction by 0.98 years per 10 micrograms per cubic metre gives about 4.7 years. Applying the same calculation to a reduction from 88.4 to the WHO guideline of 5 gives about 8.2 years.
The difference between those two estimated benefits is 3.5 years. For Delhi, meeting the national standard would deliver a large improvement, while further reductions toward the WHO guideline would bring additional gains. Both calculations depend on pollution staying at the lower level over time.
PM2.5 means particles measuring 2.5 micrometres or less in diameter, small enough to travel deep into the lungs. Exposure can affect the lungs and cardiovascular system. A microgram per cubic metre describes the mass of these particles in a given volume of air, allowing scientists to compare concentrations across places and years.
India's exposure exceeds the global average
India's annual PM2.5 concentration was 41 micrograms per cubic metre in 2023, according to EPIC. That was 8.2 times the WHO guideline and slightly above the national annual standard of 40. The estimated loss of average life expectancy across India was 3.5 years relative to the WHO benchmark.
The corresponding global estimate was 1.9 years. India's estimated loss was therefore 1.6 years greater than the global average. Delhi's concentration of 88.4 was also more than twice India's figure of 41, illustrating how a national average can conceal much higher exposure in particular places.
The EPIC India summary says India's particulate concentrations rose in 2023 compared with 2022, based on the latest satellite estimates. Globally, PM2.5 concentrations increased by 1.5% over the same period and stood at nearly five times the WHO guideline.
The geographical pattern places the greatest estimated effects across the northern Gangetic plains and around Delhi. Large parts of Jammu and Kashmir and Ladakh show smaller effects. The contrast helps explain why residents of different regions can face very different pollution burdens within the same country.
How daily air quality categories work
CPCB's Air Quality Index, or AQI, puts pollution readings on a scale that is easier to follow than a series of separate pollutant measurements. Its six categories run from good to severe:
- Good: AQI 0 to 50.
- Satisfactory: AQI 51 to 100.
- Moderate: AQI 101 to 200.
- Poor: AQI 201 to 300.
- Very poor: AQI 301 to 400.
- Severe: AQI 401 to 500.
A count of good days tells readers how often a city reached the lowest AQI category. The annual PM2.5 concentration measures average fine particle exposure over a much longer period. Reading both together gives a fuller picture: the number of cleaner days and the pollution accumulated across the year.
A city can record many good days during one season while experiencing much higher pollution during another. Its annual average reflects both. The life expectancy calculation uses that sustained exposure, while the daily category helps residents understand conditions on a particular day.
The latest daily counts stop on November 4, 2026. They cover only part of that year, so comparisons with complete years need to account for the remaining weeks, especially in cities where winter brings worse air.
Delhi and Kolkata show the seasonal divide
Delhi's five reported good days across 2022 through November 4, 2026, were concentrated in just three of those years. The city recorded three in 2022, one in 2023 and one in the partial 2026 period, with none in 2024 or 2025.
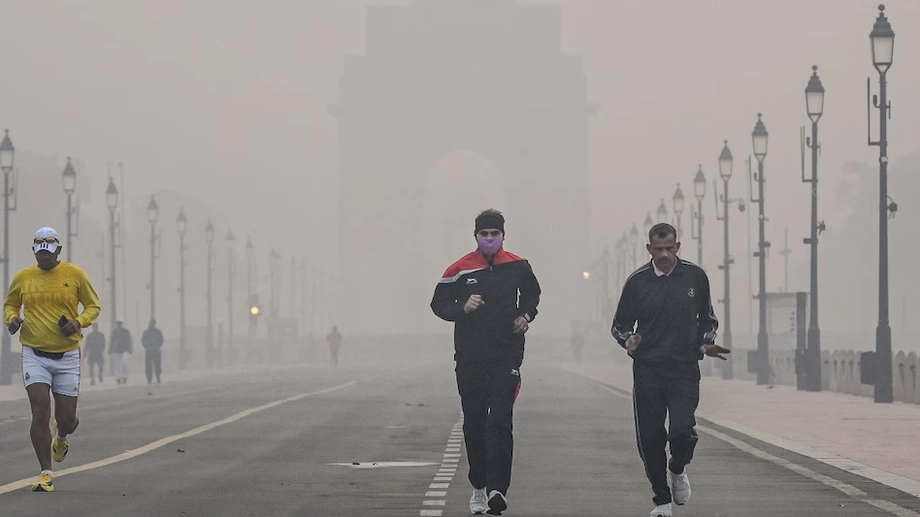
Winter frequently pushes Delhi's air into the very poor or severe categories. July and August bring some relief. Those seasonal changes sit alongside the city's annual PM2.5 concentration of 88.4 in 2023 and its position as the most affected location in the national AQLI findings.
Kolkata recorded a much steadier supply of good days: 94 in 2022, 93 in 2023, 93 in 2024 and 97 in 2025. It had another 83 by November 4, 2026. Its four complete annual counts stayed within a narrow range of 93 to 97.
Kolkata's cleaner air is concentrated in the monsoon, while pollution rises in winter. Its estimated life expectancy gain of 4.1 years under the WHO guideline shows why the annual exposure measure matters even where good days are relatively frequent. The city combines substantial seasonal relief with a continuing burden from fine particles.
Mumbai and Hyderabad have swung sharply
Mumbai's good days fell from 21 in 2022 to five in 2023, then rose to 82 in 2024 before dropping to 55 in 2025. By November 4, 2026, the city had recorded 87, already exceeding each of those complete annual totals.
The rise from five good days in 2023 to 82 in 2024 amounted to 77 additional days in the good category. Mumbai's 2023 record also had one day without an issued bulletin. Its estimated gain from reaching the WHO annual PM2.5 guideline was 3.1 years.
Hyderabad followed a different course. It recorded 48 good days in 2022, five in 2023 and 29 in 2024, followed by none in 2025. The count recovered to 50 by November 4, 2026, higher than any of the complete annual figures listed for 2022 through 2025.
Hyderabad's estimated life expectancy gain was 3.2 years, close to Mumbai's 3.1. The two cities had similar estimated benefits from permanently reducing fine particle exposure, despite very different daily records in 2025, when Mumbai had 55 good days and Hyderabad had zero.
Bengaluru and Chennai retain a measurable burden
Bengaluru recorded 36 good days in 2022, 69 in 2023, 65 in 2024 and 41 in 2025. Its count stood at 14 by November 4, 2026. Across the four complete years, its highest total was nearly twice its lowest, 69 compared with 36.
Chennai recorded 70 good days in 2022, 32 in 2023, 52 in 2024 and 36 in 2025. It had recorded 38 by November 4, 2026. As in Mumbai, one day in Chennai's 2023 record lacked an issued bulletin.
The estimated gains from meeting the WHO guideline were 2.1 years for Bengaluru and 2.2 years for Chennai. Those were the smallest estimates among the six cities, but each still represented more than two additional years of average life expectancy under sustained cleaner conditions.
Chennai had more good days than Bengaluru in 2022, while Bengaluru had more in each of the next three complete years. Their daily records changed position over time, reinforcing the value of tracking each city's exposure across several years rather than relying on a single annual ranking.
Putting the different years in order
The findings bring together a report published in 2025, annual pollution estimates from 2023 and daily air quality records extending into 2026. Keeping those dates in order makes the health estimates and the more recent conditions easier to understand.
- 2022: The daily comparison begins. Delhi records three good days, Kolkata 94, Mumbai 21, Hyderabad 48, Bengaluru 36 and Chennai 70.
- 2023: The pollution exposure year used by the 2025 AQLI. Annual PM2.5 reaches 88.4 micrograms per cubic metre in Delhi and 41 across India.
- 2024: Delhi records no good days, while Mumbai's count rises to 82 and Kolkata's remains at 93.
- 2025: The AQLI report is published. Daily records show no good days in Delhi or Hyderabad, compared with 97 in Kolkata.
- November 4, 2026: The latest daily counts reach one in Delhi, 83 in Kolkata, 87 in Mumbai, 50 in Hyderabad, 14 in Bengaluru and 38 in Chennai.
The 2026 records show changes in the frequency of good air days. The published life expectancy estimates remain tied to 2023 exposure and the benefits of permanently reaching a lower annual concentration. Measuring progress toward that goal requires continued attention to annual PM2.5 levels alongside daily AQI categories.
Key Points
- Delhi could gain an estimated 8.2 years of average life expectancy by permanently meeting the WHO annual PM2.5 guideline.
- The estimated gains are 4.1 years in Kolkata, 3.2 in Hyderabad, 3.1 in Mumbai, 2.2 in Chennai and 2.1 in Bengaluru.
- Delhi's 2023 annual PM2.5 concentration was 88.4 micrograms per cubic metre, compared with 41 across India and the WHO guideline of 5.
- Meeting India's annual standard of 40 would give Delhi an estimated life expectancy gain of 4.7 years.
- Delhi recorded no good air days in 2024 or 2025. Hyderabad also recorded none in 2025.
- The 2026 daily counts end on November 4 and cover only part of the year.