
Lower purchase ratio meets rising pressure on tenants
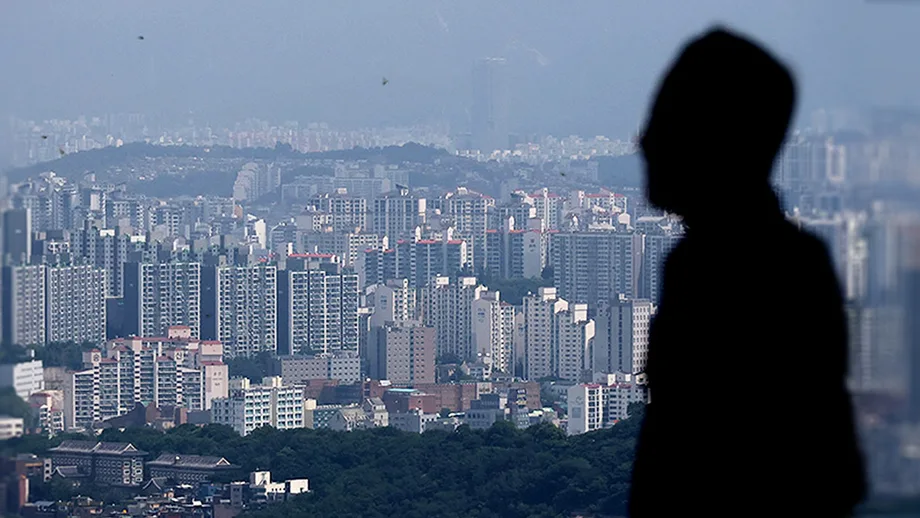
Seoul homeowners occupied properties worth a median 11.7 times their annual household income in 2025, while renters in the capital faced housing costs equivalent to 21.5% of monthly income, according to South Korea's Ministry of Land, Infrastructure and Transport. Across the country, the average wait to buy a first home after becoming a household head stretched to eight years.
Contents
- Lower purchase ratio meets rising pressure on tenants
- What does 11.7 years of income mean?
- Why did Seoul's figure fall while apartments became dearer?
- Rent takes a larger share across every region
- Young renters and newlyweds face growing costs
- Older renters still devote almost a quarter of income to housing
- More households own homes, and living space grows
- Support preferences split along income lines
- The survey calendar and the next housing milestones
- Key Points
The ministry's 2025 Housing Survey, released on November 17, 2026, covered 61,000 households. Its findings show improvements in ownership and living space alongside growing rental pressure, especially for young adults and newly married couples.
Seoul's ratio of home prices to income fell from 13.9 in 2024 to 11.7 in 2025, despite rising apartment prices. Officials attributed the decline to the survey's June price reference date and a larger share of cheaper properties in the sample. Gyeonggi Province moved in the opposite direction, with its ratio rising from 6.9 to 7.5.
Nationally, the median share of tenant income absorbed by rent reached 17%, matching the highest level since 2017. The ministry's detailed figures put the previous year's level at 15.8%, an increase of 1.2 percentage points; another published figure put the earlier level at 15.7%.
For households, the results describe two pressures unfolding together: buying a home still requires a large amount of money relative to earnings, while renting takes a growing share of the monthly budget. Among newlywed households, 73.1% reported feeling burdened by rent and loan repayments, compared with 69.3% of young households and 55.9% of households in general.
What does 11.7 years of income mean?
The price to income ratio, known as PIR, compares the value of an owner household's home with its annual household income. A ratio of 11.7 means the property's value equals 11.7 years of total income, assuming every won could be saved.
Food, transport, education and other everyday expenses make actual saving much slower. The ratio uses household income, which can include earnings from more than one person, rather than a single worker's salary.
Seoul had the highest ratio among the country's 17 provinces and major cities. Sejong followed at 7.6, with Gyeonggi at 7.5. The nationwide figure remained 6.3, unchanged from 2024.
The wider capital region, which includes Seoul, Incheon and Gyeonggi, recorded a ratio of 8.2, down from 8.7. Other major cities recorded 5.8, while provincial areas recorded 3.8. Seoul's 11.7 was therefore about 1.9 times the national figure of 6.3.
Actual first purchases followed a different timetable. Households that had bought their first home took an average of eight years after becoming a household head, up from 7.9 years in 2024 and 6.8 years in 2017. That measures an elapsed period in people's lives, while PIR measures a relationship between property value and income.
Why did Seoul's figure fall while apartments became dearer?
The survey valued homes as of June 16, 2025, the third Monday of June. Officials said that timing left out the stronger price increases during the second half of the year. The same annual reference point has been used since the survey began in 2006.
Seoul home prices had already risen more than 2% during the first half of 2025, however. Officials also pointed to the changing mix of properties in the sample, including more relatively inexpensive rowhouses and multifamily units and falling prices for some of those homes.
Kang Mina, a senior research fellow at the Korea Research Institute for Human Settlements, explained at a briefing in Sejong that the median calculation was central to the decline:
We checked multiple times for any statistical errors. The drop to 11.7 times is because we use the median. It's true apartment prices went up. But among the 61,000-household sample, changes such as a higher share of lower-priced homes shifted the middle segment of the overall home-price distribution downward. If we had used the average, it would not have fallen as much.
A median is the middle value when observations are arranged in order. A larger share of cheaper homes can move that middle downward even while expensive apartments rise. An average, calculated by adding values and dividing by their number, responds differently to expensive properties.
Gyeonggi's increase from 6.9 to 7.5 remained unexplained in detail at the briefing. Kang said researchers had examined Seoul's price distribution closely and would need to check Gyeonggi's distribution separately.
Rent takes a larger share across every region
Seoul renters had the country's highest median rent to income ratio, or RIR, at 21.5%, up from 20.8%. Gyeonggi's ratio rose from 15.2% to 17.4%, the largest increase among the 17 provinces and major cities.
The broader capital region rose from 18.4% to 19.7%. Other major cities increased from 15.2% to 16.2%, while provincial areas went from 12.7% to 13.3%. Rental pressure increased across all three regional groups.
RIR includes monthly rent and a monthly equivalent of lease deposits. That matters in South Korea because many tenants use jeonse, a system in which they provide a large deposit instead of paying ordinary monthly rent. Converting the deposit into an equivalent monthly cost allows different rental arrangements to be compared.
The 2025 calculation introduced conversion rates specific to each province or major city, replacing a single national rate. The national result remained 17% under both methods. For the capital region, the revised method produced 19.7%, compared with 20.3% under the previous method.
Lee Yuri, the ministry's director of housing policy, attributed rising rental burdens to higher jeonse and monthly rents while household incomes changed relatively little. She also pointed to recovering jeonse prices for rowhouses and multifamily housing after declines associated with fraud cases in 2022 and 2023.
Kang linked rental pressure partly to the shift from large deposits toward monthly payments. Owners and tenants face different markets: the ownership ratio follows property values relative to income, while the rental ratio follows the cost of occupying a rented home.
Young renters and newlyweds face growing costs
Young households, defined as those headed by someone aged 19 to 34, remained heavily dependent on renting. Some 80.6% rented, even as the share living in homes they owned increased from 12.2% to 14.8%.
Their median rental burden rose from 16% to 17.4%. Among newlywed households, defined as couples married for seven years or less, it increased more sharply, from 17.7% to 20.2%. That put the median rental cost above one fifth of monthly income.
Newlyweds also faced an increase in the ownership price ratio, from 6.0 to 6.2, while the figure for young homeowners fell from 6.0 to 5.6. Some 45.7% of newlywed households lived in homes they owned, up from 43.9%, while 51.6% rented.
Marriage and family decisions featured prominently in their responses. Young households rated difficult economic circumstances at 3.21 out of four as a reason for delaying or avoiding marriage, closely followed by difficulty securing housing, including deposits, at 3.19.
Newlyweds rated housing costs as the leading housing factor affecting decisions about having children, at 3.30 out of four. Housing instability followed at 3.27. Their preferred support for encouraging childbirth included expanded home purchase loans for families with several children, selected by 34%, and housing cost assistance linked to the number of children, selected by 31.1%.
Location also mattered. When considering where to live after marriage, 48.8% of young households put distance from work first, far ahead of transport convenience at 13.6%. Their responses point to demand for homes near employment as well as financial help.
Older renters still devote almost a quarter of income to housing
Households headed by someone aged 65 or older had a median rental burden of 24.7%, the highest among the age and family groups examined. It eased from 25.4% in 2024 but remained above the figures for young and newlywed renters.
Lower incomes help explain that high ratio, even where the actual rent paid is comparatively modest. Among older homeowners, the price to income ratio fell from 9.1 to 7.6.
Older households had a high owner occupation rate of 75.3%, down slightly from 75.9%. Their housing needs also extended to care and safety: 36% selected visiting medical or nursing services as the most needed service for later life, and 33.7% selected help with tasks such as meals and cleaning.
For housing improvements, 34.4% wanted emergency contact systems such as alarm buttons, while 28.9% selected automatic safety devices such as gas shutoff equipment. Home repair assistance, chosen by 21.7%, ranked almost level with purchase loan support at 21.8% among their preferred housing programs.
More households own homes, and living space grows
National homeownership reached 62%, up from 61.4%, while the share living in a home they owned increased from 58.4% to 59.1%. Both reached their highest levels since the survey began in 2006.
The two measures answer different questions. Homeownership counts households that own a home, including those living elsewhere. Owner occupation counts households actually living in a property they own.
The capital region remained below the national figures, with ownership at 56% and owner occupation at 53.1%. Provincial areas recorded 70.7% and 68.2%, respectively.
Average residential space increased from 36 to 38.2 square meters per person. Average space per household rose from 68.1 to 71.5 square meters. The share falling below minimum housing standards declined from 3.8% to 3.6%.
Young households recorded a larger improvement in minimum standards, with the share below them falling from 8.2% to 5.6%. Their apartment residence rate rose from 31% to 34.9%, while residence in spaces classified outside ordinary housing declined from 5.3% to 3.2%.
Newlyweds occupied larger homes than households in general, averaging 76 square meters, but had less space per person, at 30 square meters, because their households were larger. Among older households, the share below minimum standards rose from 2.1% to 2.5%.
Support preferences split along income lines
The share saying housing support programs were needed rose from 38.2% to 45.9%, a jump of 7.7 percentage points. Kang explained that the question asks about the need for housing support generally, allowing respondents to answer with either their own circumstances or society's needs in mind.
Home purchase loan support ranked first at 31.2%, followed by jeonse deposit loans at 21.8%, public rental housing for extended tenancies at 12.2%, and monthly rent subsidies at 11.8%.
Households with lower incomes placed greater weight on securing rented accommodation. Jeonse loan support attracted 23.1%, and monthly rent subsidies 20.1%, both ahead of purchase loan support at 17.9%. Among households with upper incomes, 47.6% chose purchase loan assistance.
Young households most often wanted jeonse loans, at 35.4%, followed by purchase loans at 21.3%. Newlyweds preferred purchase loans, at 44.9%, followed by jeonse loans at 27.2%.
Ownership remained a strong aspiration, though it weakened. The share saying a home should be owned fell from 89.6% in 2022 to 85.6% in 2025. The figure was 93.4% among households with upper incomes and 78.6% among those with lower incomes.
The survey calendar and the next housing milestones
The ministry commissioned the Korea Research Institute for Human Settlements and Korea Research to conduct the survey. Interviews took place during the second half of 2025, with 55,000 households interviewed in person and 6,000 completing remote questionnaires, a format introduced that year.
The dates separate the housing conditions measured from more recent policy announcements:
- June 16, 2025: The survey's reference date for home prices.
- Second half of 2025: Household interviews took place through both in person and remote methods.
- October 29, 2026: The government announced six proposed public housing sites near Seoul.
- November 17, 2026: The ministry released the 2025 Housing Survey findings.
- November 18, 2026: The detailed research report was scheduled for publication on the ministry's Statistics Nuri service.
The government's 76,700 home supply plan covers six sites in Gyeonggi near Seoul, with construction targeted to begin by 2030. That timetable places new supply several years beyond the rental pressures recorded in this survey.
The findings show why housing policy faces several tasks at once: helping tenants meet current costs, supporting households trying to buy, and providing homes with enough space in locations that work for their jobs and families.
Key Points
- Seoul's median home price to income ratio fell to 11.7 in 2025, from 13.9 in 2024.
- Officials attributed the decline to the June reference date and a shift toward cheaper homes in the sample.
- Median rental burdens reached 21.5% of income in Seoul and 17% nationally.
- Newlywed renters faced a 20.2% burden; older renters recorded 24.7%.
- Buying a first home took an average of eight years after becoming a household head.
- Homeownership rose to 62%, while 45.9% said housing support programs were needed.