
A repeated rupture beneath the Sanriku coast
A magnitude 7.7 earthquake struck offshore of Sanriku in northeastern Japan at 4:52 p.m. on April 20, 2026. A Kyoto University researcher says it ruptured almost the same stretch of the plate boundary as a magnitude 7.4 earthquake that hit just 22 minutes after the devastating 2011 Tohoku earthquake. The finding points to a fault that has broken more than once, while drawing attention to nearby sections that have not moved as recently.
Contents
Professor Takuya Nishimura compared satellite positioning measurements from the 2011 and 2026 earthquakes with measurements from major quakes in 1994 and December 2025. The ground shifted in nearly the same direction and by similar amounts during the 2011 and 2026 events. His fault models place their centers about 12 kilometres apart, with much of the estimated rupture area overlapping.
The April quake registered a maximum seismic intensity of 5 Upper in Aomori Prefecture. Japan's intensity scale describes how strongly shaking is felt and its effects at a location, while magnitude measures the earthquake's size at its source. The quake also caused damage and injuries, produced long period ground motion in parts of Akita and Miyagi prefectures, and sent tsunami waves along the Pacific coast from Hokkaido to Tohoku.
Nishimura said the fault appeared to have released strain in the April earthquake, but warned that nearby parts of the plate boundary still need attention. The professor put his concern this way:
Attention must now be paid to the possibility of earthquakes in adjacent areas.
The distinction matters because a rupture can relieve pressure on the part of a fault that moved while changing the stresses around its edges. Nishimura's research identifies the central section of the older 1968 rupture area as a particular point of concern: it last saw substantial movement in 1994.
What the measurements reveal
The Earthquake Research Committee's official earthquake evaluation, dated May 14, places the April event at a depth of about 20 kilometres. Its fault mechanism indicates reverse faulting at the boundary where the Pacific Plate moves beneath the continental plate. In simple terms, one side of the boundary was pushed up over the other as the plates pressed together.
Satellite positioning stations recorded the ground's movement. At the S-Fudai station in Iwate Prefecture, the land shifted about 9 centimetres east and sank about 1 centimetre. Roughly 10 days later, the Taro-A station in Miyako recorded about 2 centimetres of additional eastward movement, which the committee described as likely post earthquake deformation.
The committee reported provisional tsunami heights of 79 centimetres at Kuji Port in Iwate and 39 centimetres at Urakawa in Hokkaido. Aftershocks included events of magnitude 5.6 on April 20, 5.3 on April 22 and 5.1 on April 27. From April 20 through April 30, 38 earthquakes in the area reached seismic intensity 1 or higher. The committee said the activity zone stretched about 150 kilometres from northwest to southeast.
The same evaluation noted that tremor activity increased east of the April epicentre. Tremors are small, repeated signals linked to movement along a fault, and can occur alongside ordinary earthquakes or slow movement that does not produce strong shaking. The committee also reported an increase in estimated slow slip in the area.
How close were the 2011 and 2026 sources?
Nishimura's GNSS study, published on October 26, estimates the April earthquake at magnitude 7.5 using geodetic measurements. That estimate differs from the Japan Meteorological Agency magnitude of 7.7 used in the committee's evaluation. The figures come from different methods of measuring earthquake size, so both appear in the scientific record.
The study compares the pattern of ground movement, not just the reported magnitude. The 2011 and 2026 measurements were nearly identical in direction and size, and the difference between their observed movements showed no clear pattern that would suggest widely separated sources. The estimated fault centres were about 12 kilometres apart, even though the two earthquakes' epicentres were about 33 kilometres apart. An epicentre marks the point on the surface above where a quake begins; the fault area that slips underground can extend away from it.
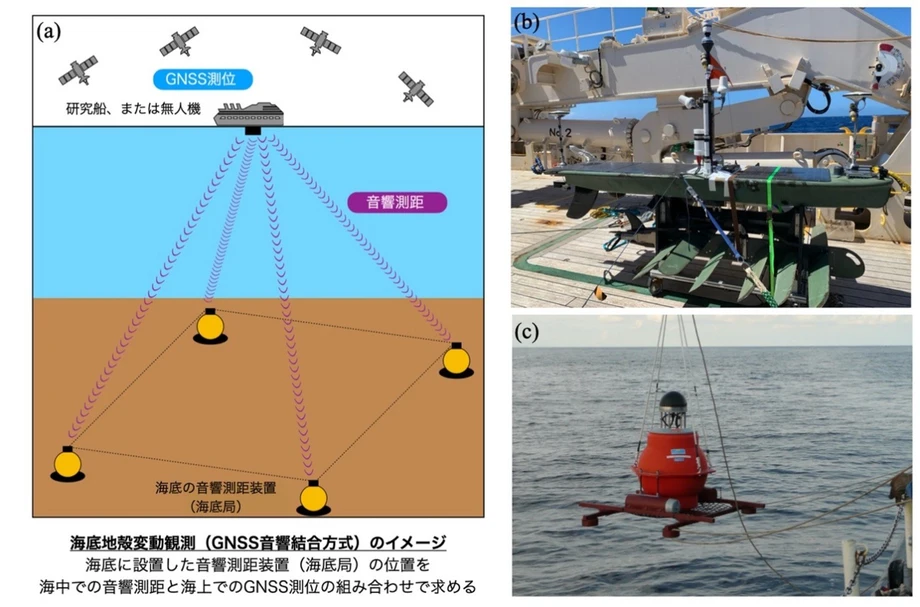
GNSS is a satellite positioning system, including GPS, that measures small changes in the position of monitoring stations. When a large fault slips, stations on nearby land move. By comparing those movements, researchers can estimate where the fault moved and how large the slipping area was. Nishimura's analysis is based on permanent monitoring stations, rather than on shaking measurements alone.
The April earthquake occurred near the southern edge of the source area of the 1968 Tokachi-oki earthquake. The committee gives that earlier quake a magnitude of 7.9; Nishimura's academic paper refers to it as magnitude 8.3. The study estimates the 1968 event's seismic moment at 3.5 × 10²¹ newton metres, compared with a combined 6.8 × 10²⁰ newton metres for the 1994, 2025 and 2026 earthquakes. Seismic moment reflects the area of fault that moved, how far it slipped and the strength of the rock. The comparison shows that the 1968 rupture released much more total energy than the three later events combined.
Three sections within the older rupture area
The study maps the 2025, 1994 and 2026 sources to the northern, central and southern parts, respectively, of the 1968 rupture area. Researchers call these sections asperities, meaning patches of a fault that tend to stick as the plates push together and then slip in an earthquake. A single large quake can rupture several such patches at once, or they can break separately over time.
The December 2025 earthquake offshore of eastern Aomori, estimated at magnitude 7.5 by the committee, corresponds to the northern section. The 1994 Sanriku-haruka-oki earthquake, magnitude 7.6 in the committee's account, corresponds to the central section. It reached a maximum intensity of 6 under the Japanese scale in use at the time. The April 2026 event corresponds to the southern section and repeated the 2011 rupture there.
The southern section has a longer record of repeated movement. The study identifies ruptures there in 1960, 1968, 1989, 2011 and 2026, a pattern with intervals ranging from eight to 21 years across 66 years. Nishimura's broader regional count also finds five earthquakes of magnitude 7 to 8 since 1960, separated by intervals of eight to 21 years. The region is among the most active around Japan for earthquakes of this size.
The central section presents a different concern. It has not had significant movement since the 1994 earthquake, according to Nishimura. The paper describes a seismic gap about 70 kilometres wide and says the 2025 and 2026 ruptures on neighbouring sections may increase stress on the central asperity. That possibility does not set a date for another earthquake, but it helps explain why the areas around the latest ruptures matter as well as the fault that already broke.
A busy sequence across several years
The April quake was part of a wider sequence of activity around the northern Japan Trench and the southern Kurile Trench. The official evaluation places the 2026 source beside the southern side of the 1994 source area, near the southern edge of the 1968 rupture. It also records intense episodes in 1989, 1992, 2012 and 2015, each involving many earthquakes of magnitude 6 or greater.
The 2019 long term assessment classified the relevant offshore areas as Rank III, the highest probability category for subduction zone earthquakes in the committee's system. Rank III means a probability greater than 26% of an earthquake in the assessed category occurring within 30 years. The assessment described the expected events as slightly smaller interplate earthquakes, around magnitude 7 to 7.5, in areas offshore eastern Aomori and north and south of Iwate.
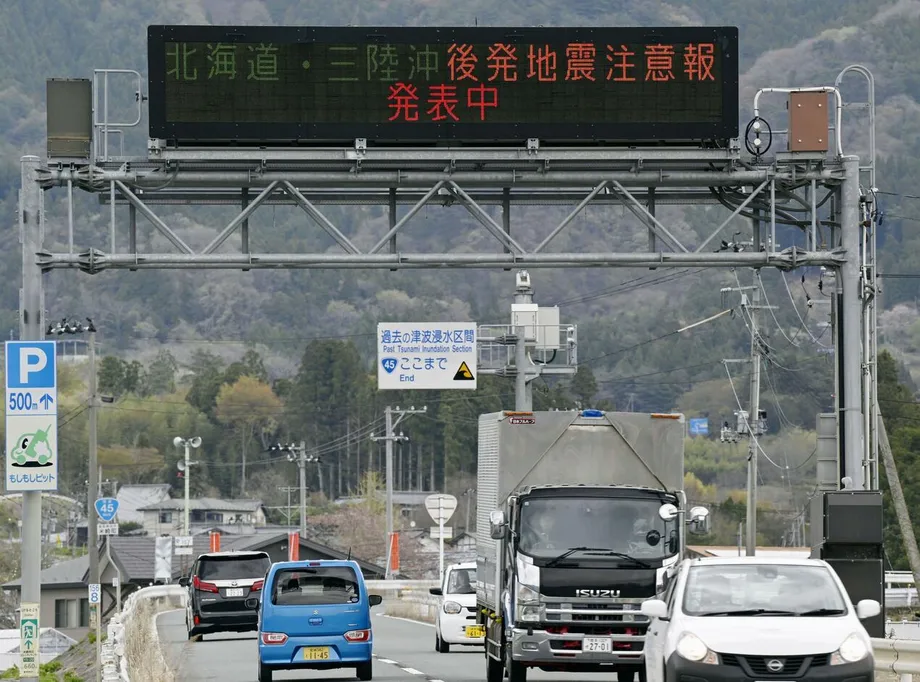
The sequence also led to a subsequent earthquake advisory, according to Nishimura's paper. Such an advisory tells the public that the chance of another large earthquake is relatively higher than under normal conditions after a magnitude 7 or greater event in areas covered by the warning system. It is a notice about increased risk, rather than a prediction of the time or place of a future quake.
The main dates trace how researchers reached the current picture:
March 11, 2011: A magnitude 7.4 earthquake struck 22 minutes after the magnitude 9.0 Tohoku earthquake.
November and December 2025: Earthquakes offshore of Sanriku and eastern Aomori added activity in the southern and northern parts of the 1968 rupture area.
April 20, 2026: The magnitude 7.7 Sanriku earthquake struck at 4:52 p.m., followed by further earthquakes and tsunami waves.
May 14, 2026: The Earthquake Research Committee published its evaluation of the April event and continuing activity.
October 26, 2026: Nishimura's GNSS study was published, presenting the comparison of the 1994, 2011, 2025 and 2026 earthquakes.
What the pattern can and cannot tell residents
The measurements show why earthquake monitoring looks beyond the strongest shaking. A fault can rupture repeatedly in roughly the same place, while nearby sections have their own histories of movement. In this case, the researchers connect four major events to distinct sections of a larger historical rupture area, and find a close match between the 2011 and 2026 sources.
The official evaluation records continued seismic activity after April 20, although the number of earthquakes declined. It also notes that the 2025 and 2026 sources sit beside other active areas, and that the central part of the 1968 rupture area last moved substantially in 1994. The next earthquake's location and timing remain unknown; the available probability assessment describes risk across a 30 year period, not a specific forecast.
For people along the Pacific coast, the practical lesson in the committee's figures is that a strong offshore earthquake can bring both damaging shaking and tsunami waves, while aftershocks continue. The April event produced a 79 centimetre provisional tsunami reading at Kuji Port and 38 earthquakes with intensity of at least 1 in its first 11 days. The repeated fault finding adds a longer view: scientists are tracking not only where the latest rupture happened, but also which neighbouring sections have been active and which have not.
Key Points
The April 20, 2026, magnitude 7.7 earthquake offshore of Sanriku ruptured a source area that largely overlaps the 2011 magnitude 7.4 aftershock source.
GNSS measurements place the estimated fault centres about 12 kilometres apart; the study gives the 2026 quake a geodetic magnitude of 7.5.
The official evaluation reports a provisional tsunami height of 79 centimetres at Kuji Port and 38 earthquakes with intensity of at least 1 from April 20 through 30.
The 2025, 1994 and 2026 earthquakes are mapped to northern, central and southern sections of the 1968 Tokachi-oki rupture area.
The central section last moved substantially in 1994. Researchers say adjacent ruptures may affect its stress, while the timing and location of any future earthquake are unknown.