
496 million move above a key poverty threshold
India's poverty rate fell from 57.7% in 2011 to 16.1% in 2023 at the World Bank's $4.20 daily threshold, moving an estimated 496 million people above that line. Yet about 57% of those still poor live in a belt stretching from Uttar Pradesh to West Bengal, making progress in this corridor central to the country's next phase of poverty reduction.
Contents
- 496 million move above a key poverty threshold
- What the different poverty lines tell us
- How the decline unfolded
- Why the eastern corridor matters
- More employment, but limited gains in pay
- Education and basic services shape who remains poor
- Why survey changes are part of the debate
- India's domestic poverty measures remain unsettled
- The next gains depend on better work
- Key Points
The World Bank's India poverty brief, dated October 2026, also puts extreme poverty at 2.6% in 2023, down from 27.1% in 2011. That measure uses a lower threshold of $3 per person per day.
The remaining challenge extends beyond helping households cross either line. Employment expanded by about 134 million people between 2017 and 2023, but real earnings have changed little recently. Young people face rising unemployment, and poorer regions continue to have fewer opportunities for productive work outside agriculture.
Questions about measurement also matter. India redesigned its household consumption surveys between the starting and ending years. The World Bank describes them as broadly comparable while acknowledging that some recent gains reflect better measurement alongside genuine improvements in living standards.
What the different poverty lines tell us
The $3, $4.20 and $8.30 thresholds describe different minimum living standards. They are expressed in 2021 purchasing power parity, or PPP, which adjusts for differences in prices between countries. They are not amounts converted into rupees at a bank's exchange rate.
India's estimates rely on household consumption, meaning the goods and services people use, rather than wages alone. Consumption can include spending supported by several earners, savings or public assistance.
The World Bank estimates that about 37 million Indians remained below $3 a day in 2023, while roughly 232 million were below $4.20. At the $8.30 threshold used for countries with upper middle incomes, the share was much higher: 80%, or about 1.15 billion people.
Subtracting the 16.1% below $4.20 from the 80% below $8.30 shows that 63.9% of Indians lived between those thresholds. This large group had crossed the lower benchmark while still having consumption below the higher one.
The World Bank's poverty brief programme covers more than 100 developing countries and publishes twice a year. Its common thresholds allow comparisons across countries, alongside national poverty lines and measures of education, services and inequality.
How the decline unfolded
The fall at the $4.20 line amounts to 41.6 percentage points between 2011 and 2023. Extreme poverty fell by 24.5 percentage points over the same period. The World Bank attributes the gains mainly to stronger consumption, rising employment, especially among women, and expanded social transfers, including food subsidies.
The latest estimates draw on three household surveys: the Consumption Expenditure Survey of 2011–12 and the Household Consumption Expenditure Surveys of 2022–23 and 2023–24. The brief labels its latest monetary poverty estimates as 2023.
- 2011–12: The baseline household survey underpins estimates of 57.7% poverty at $4.20 and 27.1% at $3.
- 2022–23: The newer survey recorded poverty of 23.9% at $4.20 and extreme poverty of 5.3%.
- 2023–24: The next survey underpins the brief's 2023 estimates of 16.1% and 2.6%, respectively.
- October 9, 2026: The World Bank dated its latest India brief, with projections extending to 2028.
The World Bank's publication record identifies the October release. Its projections put poverty at the $4.20 line at 14.2% in 2026 and 12.1% in 2028. These are modelled estimates that the bank says it will update as economic and labour market data change.
Why the eastern corridor matters
Uttar Pradesh, Bihar, Jharkhand and West Bengal combine large populations with relatively low incomes and persistent shortages of productive employment. The World Bank says the wider contiguous belt from Uttar Pradesh to West Bengal contains about 57% of India's poor, although its brief does not publish individual state poverty rates.
Reserve Bank of India figures for 2024–25 put Bihar's annual income per person at about Rs 69,211, compared with roughly Rs 110,000 in Uttar Pradesh, Rs 117,000 in Jharkhand and Rs 164,000 in West Bengal. West Bengal's figure is about 2.4 times Bihar's, showing substantial differences even within this corridor.
Rural poverty also remains much higher than urban poverty. At the World Bank's $4.20 line, 19.3% of rural residents were poor in 2023, compared with 8.6% of urban residents. The rural rate was therefore more than twice the urban rate, despite faster progress in rural areas over the longer period.
The Access (In)Equality Index 2026, produced by the Centre for New Economics Studies at O.P. Jindal Global University, adds evidence about access to services. Regional differences account for 54% of variation in state scores and about a third after adjustment for income. Three states in the east and northeast rank in the bottom third across all five areas assessed: basic amenities, education, health, socioeconomic security and justice.
The index also shows variation within regions, including strong performance by Sikkim. For poorer states, the practical challenge is that weak healthcare, schooling and economic security often occur together, leaving households facing several disadvantages at once.
More employment, but limited gains in pay
India added about 134 million employed people between 2017 and 2023, nearly twice the increase in its population of working age. Rural women entering paid work contributed substantially, increasing the number of earners in many households.
The World Bank nevertheless says real earnings, meaning earnings adjusted for inflation, remained broadly unchanged recently. Much employment growth occurred in activities with relatively low productivity, where workers produce less value and wages tend to be limited.
The brief describes the earnings gap this way:
median earnings among the top 10 percent of workers were about 13 times those of the bottom 10 percent in 2023.
Youth unemployment rose from 14.6% in the first quarter of fiscal 2026 to 15.9% in the corresponding quarter of fiscal 2027, particularly affecting rural young women. That is an increase of 1.3 percentage points. Unemployment measures people seeking work; young people outside employment, education and training form a broader group.
In 2025, more than a quarter of people aged 15–29 were outside employment, education and training in 81% of Bihar's districts, 75% of West Bengal's and 69% of Uttar Pradesh's. Those percentages describe the share of districts crossing that threshold.
Factory figures show mixed progress. Uttar Pradesh recorded a 12.8% increase in factory numbers in 2024–25, the largest among states. Factory worker wages in Jharkhand fell 5.2%, against a national rise of 5.3%. The ILO's India Employment Report 2024 also found that about 90% of workers were informally employed, while self employment accounted for 55.8% of employment in 2022.
Education and basic services shape who remains poor
Adults with less education face much higher poverty rates. Among people aged 16 and above, the World Bank puts poverty at 21.3% for those without education, 17.3% for those with primary education, 14% for secondary education and 7.4% for education beyond secondary school.
The gap between adults without education and those with the highest education category is 13.9 percentage points. Better schooling can widen access to jobs and skills, while the earnings figures show why the availability and quality of employment also matter.
Children face greater exposure to household poverty. At the $4.20 line, 21.8% of children aged under 15 were poor, compared with 14.4% of people aged 15–64. Families supporting more children or older relatives must stretch earnings across more people, one reason the bank identifies high dependency ratios among remaining poor households.
Multidimensional poverty measures examine several shortages together. The Oxford Poverty and Human Development Initiative's measure fell from 53.8% in 2005–06 to 16.4% in 2019–21. The World Bank's own measure put multidimensional poverty at 15.5% in 2022–23.
NITI Aayog uses a national framework that also includes maternal health and bank accounts. Its 2023 progress review estimated that 135 million people moved out of multidimensional poverty between 2015–16 and 2019–21. A subsequent estimate put the rate at 11.28% in 2022–23, down from 29.17% in 2013–14, representing about 248.2 million people. The different indicators and periods explain why these totals differ from the World Bank's monetary poverty count.
Why survey changes are part of the debate
India's newer consumption surveys expanded the list of items households were asked about by roughly 17% and increased household visits from one to three. More detailed questions and shorter interviews can capture purchases people previously forgot, raising recorded consumption.
The World Bank adjusted the surveys to improve comparability, including using a common approach to how households recalled different purchases and adjusting for price differences across places and time. Its methodology nevertheless says the large gains between 2022–23 and 2023–24 likely reflect both genuine welfare improvements and better measurement.
Economist Eeshani Kandpal argues that the uncertainty deserves greater attention. No bridge survey, which would apply old and new methods to comparable households, was conducted to isolate the effect of the redesign.
Kandpal's illustrative calculation holds the shape of the 2011 consumption distribution constant while applying measured growth in average consumption. It produces extreme poverty near 6%. She calculates that a measurement uplift of roughly 15% around the threshold could bring that result to 2.6%, demonstrating how sensitive the headcount can be to measurement assumptions.
The most recent annual change also warrants attention because both surveys used the newer design. Extreme poverty fell from 5.3% to 2.6%, while the consumption Gini index fell from 25.5 to 23. The Gini measures inequality, with lower values indicating a more equal distribution. The World Bank acknowledges that surveys may miss consumption among richer households and understate inequality. Its population weights also rely on the 2011 Census framework, likely understating today's urban share.
India's domestic poverty measures remain unsettled
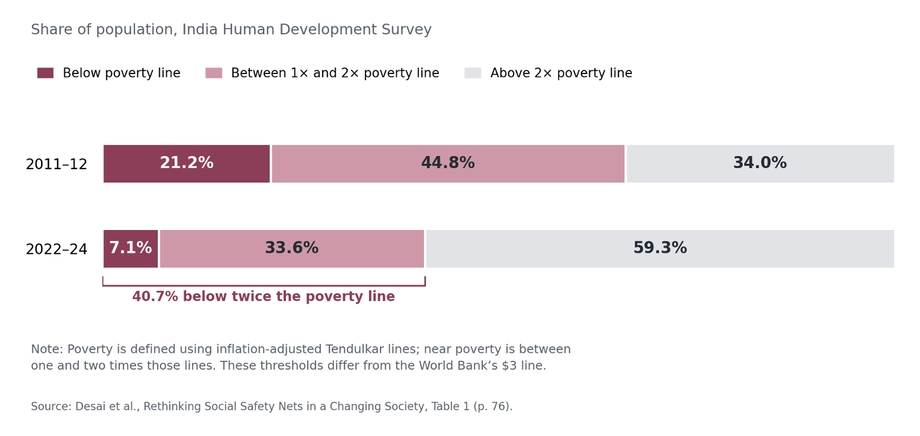
India has not published a new official national estimate of poverty based on consumption after 2011–12. The government did not formally accept the Rangarajan committee's proposed poverty lines, and researchers have since updated different older methods to analyse newer surveys.
Himanshu, an associate professor at Jawaharlal Nehru University and visiting fellow at the Centre de Sciences Humaines, argues for a fresh domestic poverty line tied to minimum needs. He also questions adjustments to the World Bank's welfare measure, including exclusions of spending on durables and medical expenses and inclusion of estimated values for some free goods.
Alternative calculations produce widely different results. For 2022–23, Sethu, Abhinav Surya and Ruthu estimated poverty at 26.4% using a Rangarajan approach, while C Rangarajan and S Mahendra Dev estimated 10.8%. SBI estimates updating Tendulkar poverty lines put rural poverty at 7.2% and urban poverty at 4.6%. Definitions of consumption, thresholds and adjustments drive these differences.
An RBI staff paper updating the Rangarajan approach for 20 major states found rural poverty highest in Chhattisgarh at 25.1%, followed by Jharkhand at 16.6%. Urban rates were 13.3% and 12.6%, respectively. Under that calculation, urban Bihar improved from 50.8% in 2011–12 to 9.1% in 2022–23.
These domestic calculations illustrate why the choice of measure matters for state policy. Himanshu notes that many programme allocations and Finance Commission decisions on distributing resources still draw on poverty estimates from 2011–12. Updated national and state measures would give governments a more current basis for deciding where assistance is needed.
The next gains depend on better work
The projected fall from 14.2% in 2026 to 12.1% in 2028 amounts to 2.1 percentage points. The World Bank expects progress to continue more gradually as poverty becomes concentrated among households with fewer assets, less education and weaker access to stable employment.
The figures point to concrete priorities in the Uttar Pradesh to West Bengal corridor: productive jobs, stronger earnings and access to education and basic services. Food support helps households meet immediate needs, while stable employment gives families a more dependable way to sustain higher consumption.
India's poverty reduction is substantial across several measures. The next task is to reach households left behind while improving the surveys and domestic benchmarks used to count them. With nearly two thirds of the population between the $4.20 and $8.30 thresholds, progress toward a more comfortable living standard remains a much larger undertaking than crossing the lowest poverty line.
Key Points
- The World Bank estimates that 496 million people moved above $4.20 a day between 2011 and 2023.
- Poverty at that threshold fell from 57.7% to 16.1%; extreme poverty at $3 fell from 27.1% to 2.6%.
- About 57% of India's poor live in the belt stretching from Uttar Pradesh to West Bengal.
- Employment expanded, but real earnings changed little recently and youth unemployment rose to 15.9%.
- Survey redesign, incomplete capture of richer households and differing poverty definitions create uncertainty about the precise scale of progress.
- The World Bank projects poverty at $4.20 to fall to 12.1% by 2028, subject to revisions.