
One in six people falls below the official poverty line
Sri Lanka's national poverty rate reached 16%, or about 3.42 million people, in preliminary findings from the first quarter of the 2025 Household Income and Expenditure Survey. Average household income rose to 120,266 rupees a month, yet its purchasing power was nearly 8% lower than in 2019, according to the Department of Census and Statistics.
Contents
The figures reveal the pressure behind the country's economic recovery: households receive more rupees, but those rupees buy less. For the household in the middle of the income distribution, purchasing power fell by an even larger 11.1% compared with 2019.
Poverty is also distributed unevenly. The estate sector recorded the highest rate, at 23%, while rural areas accounted for about 2.9 million of the people living below the official threshold. Urban areas had a substantially lower poverty rate of 7.8%.
The findings are preliminary and cover the first quarter, rather than the whole of 2025. A subsequent parliamentary statement dated October 16, 2026, said publication of the complete survey had been postponed from October to December 2026 while officials continued checking and processing the data.
For families and policymakers, two related problems emerge: the cost of meeting basic needs has risen sharply, and the detailed information needed to direct welfare support is taking longer to complete.
Why a larger income can buy less
The survey puts average monthly household income at 120,266 rupees and average expenditure at 116,191 rupees. Both figures describe money amounts at current prices. Economists call these nominal values.
Purchasing power measures something more practical: how much food, transport and other goods and services that money can actually buy. Adjusting income for inflation allows a comparison with 2019 without treating higher prices as an improvement in living standards.
On that basis, average household income fell by nearly 8%. Put simply, an income that could buy 100 units of goods and services in 2019 would buy roughly 92 units after the adjustment, even though the number of rupees received had increased.
The 11.1% decline for the household in the middle of the distribution gives another view of the squeeze. This middle value, called the median, divides households into two equal groups by income. An average, by contrast, can be pulled upward by households with very high earnings.
The median decline was about 3 percentage points larger than the average decline. Together, the two measures show that the loss of purchasing power reached beyond households already below the poverty line and affected the middle of the income distribution.
The cost of basic needs more than doubled
The official poverty line used in the preliminary findings was 16,417 rupees per person per month, compared with 6,966 rupees in 2019. That is an increase of 9,451 rupees, or approximately 136%.
A poverty line is a monetary threshold representing the cost of meeting basic needs. The poverty headcount is the share of people whose measured living standards fall below that threshold. At 16%, the national rate means roughly one person in every six was below the official line.
For a household of four, multiplying the individual threshold gives 65,668 rupees a month, compared with 27,864 rupees using the 2019 figure. This simple illustration shows how sharply the benchmark cost has increased for a family of that size.
The department also reported a national poverty line of 17,742 rupees for September, although the year was not specified in that update. That figure was 1,325 rupees, or about 8.1%, above the 16,417 rupee threshold cited in the preliminary survey findings.
The September update describes the cost threshold for that month. Calculating how many people fall below it requires household spending information alongside the threshold, which is why the income and expenditure survey matters.
Where poverty is most concentrated
The estate sector's poverty rate of 23% was nearly three times the urban rate of 7.8%. The rural rate stood at 17.3%, about 2.2 times the urban figure. These differences show how unevenly economic hardship is spread across the country.
Rural areas contain the largest number of people in poverty: approximately 2.9 million out of the national total of 3.42 million. Using those rounded figures, rural residents account for about 85% of all people below the official poverty line.
The estate and rural figures point to different demands on welfare policy. The estate sector has the highest concentration of poverty within its population, while rural areas have the largest number of people needing help. A programme concerned with reaching the most people must account for both.
District poverty lines also vary because the cost of basic needs differs by location. In the September figures, Colombo had the highest threshold at 19,136 rupees per person per month, followed by Gampaha at 19,037 rupees and Kalutara at 18,624 rupees.
Monaragala had the lowest district threshold, at 16,965 rupees. Colombo's figure was 2,171 rupees, or about 12.8%, higher. The district thresholds measure local costs, while the sector poverty rates measure the proportion of residents below the relevant line. Both are needed to understand where living costs and household resources leave people under pressure.
Household budgets leave little room
Average monthly expenditure of 116,191 rupees amounted to about 96.6% of average monthly income of 120,266 rupees. Subtracting the two averages leaves 4,075 rupees.
That narrow difference helps explain the pressure visible in the survey. A household facing an unexpected bill has less flexibility when routine expenses already absorb most of its resources. Individual families will have very different budgets, particularly across the income distribution.
Spending more rupees has also brought little change in real consumption compared with 2019. Once rising prices are taken into account, the increase in expenditure was modest. Much of the larger cash outlay therefore went toward meeting higher costs rather than buying substantially more.
The income and spending figures describe a recovery that households experience through their budgets. Higher cash receipts can coexist with reduced purchasing power, while larger payments for essentials can leave families feeling little improvement in daily life.
Why the complete survey was delayed
The Department of Census and Statistics, which operates under the Ministry of Finance, Planning and Economic Development, collected information from 25,000 households across Sri Lanka over 12 months for the full 2025 survey. The first quarter findings provide an early picture within that longer exercise.
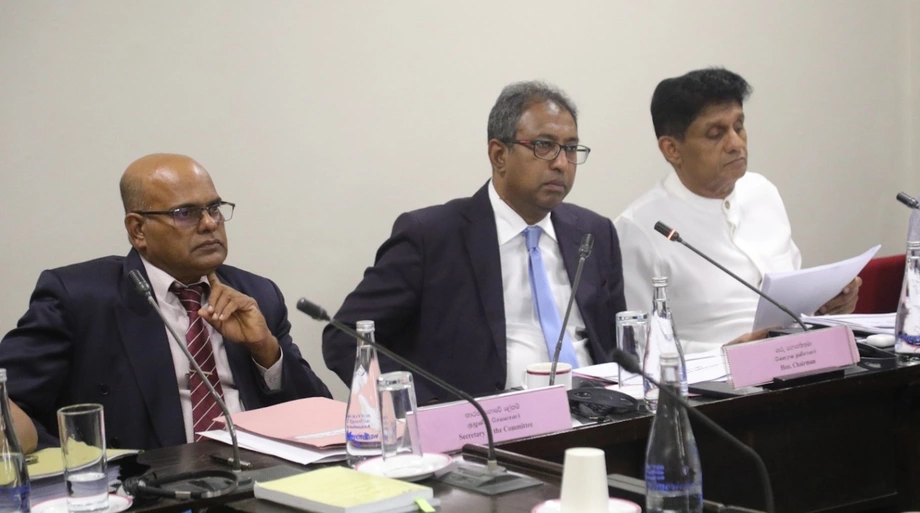
Parliament's Committee on Public Finance later examined the survey alongside poverty, income distribution and household welfare. Parliament's October 16, 2026, statement described why the complete report would take longer to publish:
Officials informed the committee that although the report was originally scheduled for release in October 2026, the release date has been deferred to December 2026 due to complexities in data cleaning, delays in computerization, cadre vacancies, and work related to the Economic Survey,
Data cleaning means checking survey entries for errors, missing information and inconsistencies before calculating results. Officials told the committee that cleaning, verification and analysis were still underway.
The main dates and benchmarks are:
- 2019: The comparison year for purchasing power, with an official poverty line of 6,966 rupees per person per month.
- First quarter of 2025: Preliminary survey findings put poverty at 16%, affecting about 3.42 million people.
- During 2025: Information for the complete survey was gathered from 25,000 households over 12 months.
- October 16, 2026: Parliament announced the publication delay.
- December 2026: The revised release month for the complete report.
The full report is due to provide a broader picture than the first quarter results, covering household circumstances across the year.
What the figures mean for welfare support
The Committee on Public Finance also examined whether the consumer basket used to calculate the poverty line reflects current living costs and basic needs. A consumer basket is a specified collection of goods and services used to estimate what people need to spend.
Updating prices answers how much that basket costs today. Reviewing its contents asks a different question: whether the goods and services included still match people's basic needs. The committee raised the need to examine both the underlying data and the basket.
Aswesuma, Sri Lanka's welfare programme, was another focus of the discussion. The committee highlighted the need for information used to identify beneficiaries to reflect current household income and expenditure.
The preliminary findings make that task concrete. Rural areas contain about 85% of people counted as poor, the estate sector has the highest poverty rate, and purchasing power has fallen more sharply for the middle household than for the average. Those patterns provide distinct signals about where support is needed and how widely financial pressure extends.
Accurate household records matter because decisions about assistance depend on who needs support now. The December report is the next scheduled step toward a fuller statistical picture, while the preliminary figures already show how higher basic costs have weakened household finances.
Key Points
- Preliminary findings for the first quarter of 2025 put poverty at 16%, affecting about 3.42 million people.
- Average monthly household income reached 120,266 rupees, but purchasing power was nearly 8% below 2019 levels.
- The household in the middle of the income distribution experienced an 11.1% decline in purchasing power.
- The poverty line cited in the survey rose to 16,417 rupees per person per month from 6,966 rupees in 2019.
- The estate sector had the highest poverty rate, at 23%; rural areas contained about 2.9 million people living in poverty.
- The complete 2025 survey report was postponed from October to December 2026 for further processing and verification.