
Everyday groceries face another round of increases
Japan faces price increases on 1,477 food and beverage products in November 2026, with an average increase of 17%, according to Teikoku Databank. Mayonnaise, bottled tea, nutritional foods and chocolate snacks are among the products affected, extending pressure on household budgets even as the autumn wave of increases slows.
Contents
- Everyday groceries face another round of increases
- Which products will cost more?
- A slower autumn, measured against a low November
- What the 17% average means
- Two years above 20,000 increases
- Ingredients, electricity and wages push up costs
- Households face pressure beyond packaged food
- Food tax relief reaches a November debate
- What manufacturers may do in 2027
- Key Points
The private research firm's November price survey, published on October 30, covers 195 major food manufacturers and focuses mainly on products for household use. November's total is almost 10 times the 150 products recorded in the same month of 2025, and the second highest November count since 2022.
Seasonings account for 644 increases, followed by 417 alcoholic and other beverages and 275 processed foods. Together, those three categories represent 1,336 products, or about 90% of November's total. The concentration puts many routine purchases, from ingredients used in cooking to drinks bought for school or work, within the latest round.
Teikoku Databank expects the pace of increases to become gentler in 2027 as companies watch how customers respond. For now, manufacturers continue to face expensive ingredients, electricity, wages and transport, while households have limited room to absorb higher bills.
Which products will cost more?
Kewpie's increases begin on November 1 and cover about 90% of its household products, including mayonnaise, dressings and pasta sauces. Seasonings are November's largest category for the first time since September, showing how the latest changes reach basic ingredients used across many meals.
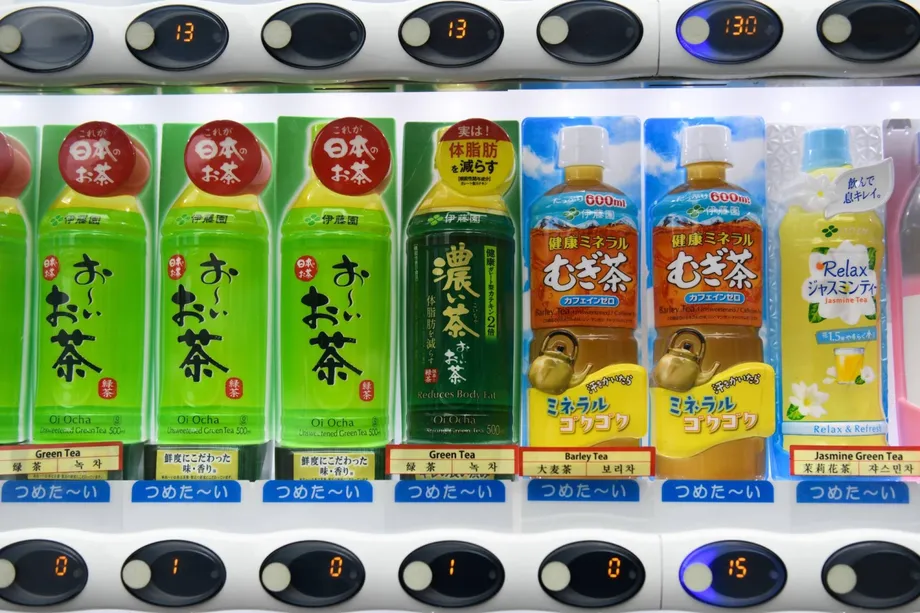
Drink increases include Ito En's Kenko Mineral Mugicha barley tea, Asahi Soft Drinks' Calpis Water and Mitsuya Cider, and Suntory Beverage & Food's Iemon tea and C.C. Lemon. Coffee drinks and other bottled beverages also feature in the survey.
Otsuka Pharmaceutical's CalorieMate and all SOYJOY varieties are among the nutritional foods affected. Meiji products include Kinoko no Yama, Takenoko no Sato and Galbo chocolate pouches. Within processed foods, the survey highlights canned seafood and foods for infants and young children.
The range matters because households encounter the changes across several parts of a shopping trip. A family replacing a bottle of dressing, buying drinks and stocking food for a young child may face increases on several purchases at once.
A slower autumn, measured against a low November
November's 1,477 increases follow 4,965 in September and 3,153 in October. The November count is about 53% lower than October's, bringing the monthly total below 3,000 for the first time in three months. It also falls below 2,000 for the first time in five months.
The comparison with November 2025 tells a different part of the story. Last November had only 150 increases, making this year's count roughly 9.8 times as large. Japan can therefore experience a sharp slowdown from October while still recording an unusually busy November.
The main dates show how concentrated the changes have been:
- September 2026: Manufacturers recorded 4,965 food and beverage price increases.
- October 2026: Another 3,153 products were affected.
- October 30: Teikoku Databank published its November survey and outlook.
- November 1: Kewpie's increases begin across about 90% of its household products.
- December 2026: Teikoku Databank expects a relatively small number of further increases.
September and October together accounted for 8,118 increases, about 40% of the 20,327 already identified for the full year. November follows that concentrated burst, rather than marking an end to rising food prices.
What the 17% average means
Teikoku Databank puts November's average increase per price revision at 17%. Its method uses the maximum rate announced for each revision and includes changes in which the package becomes smaller while the price stays unchanged.
A smaller package raises the cost of each gram or serving. For example, paying the same amount for less food means a household must buy replacement supplies sooner. Comparing the price per 100 grams, per litre or per serving helps make that change visible.
The survey counts announced product price revisions. A product increased twice during the year is counted twice, so the annual total measures pricing actions, including repeated increases on the same product. The 17% figure applies to the affected revisions in November; an individual household's bill depends on the products it buys, their quantities and shop prices.
Manufacturers' announced changes also give a different view from a broad consumer price index, which tracks prices across a basket of goods and services. This survey identifies where companies are changing food prices and how frequently those changes occur.
Two years above 20,000 increases
Teikoku Databank has identified 20,327 increases scheduled or implemented from January through December 2026. That puts the annual count above 20,000 for a second consecutive year and only 282 below the 20,609 recorded in 2025.
Processed foods lead the annual categories with 6,968 increases, compared with 4,791 in 2025. That is an increase of 2,177, or about 45%. Frozen foods and packaged cooked rice are among the products in this category, bringing repeated pricing pressure to foods that offer quick meal preparation.
Seasonings account for another 6,258 increases, followed by 3,381 alcoholic and other beverages and 1,415 confectionery products. Processed foods, seasonings, confectionery and raw food ingredients have each exceeded their respective totals for the previous year.
Beverages show how the pressure shifts between months. October's beverage count reached 1,471, partly because liquor tax changes affected low malt beer and beer substitutes. November's beverage total falls to 417, with coffee drinks, bottled drinks and soft drinks among those affected.
Ingredients, electricity and wages push up costs
Higher raw material costs are associated with 91.7% of the price increases assessed for 2026, making them the most common reason. Energy costs feature in 63.9%, labour costs in 51.5%, and conditions in the Middle East in 27.5%.
Companies can cite several pressures for the same increase, so the percentages overlap. A manufacturer may face more expensive ingredients, higher electricity bills at its factory and higher wages at the same time.
Raw materials remain the leading factor, although their share is the lowest annual reading since Teikoku Databank began tracking reasons in 2023. Energy's share has risen for two consecutive years, while labour costs have reached their highest recorded share.
Teikoku Databank also identifies pressure from Middle East conditions on petroleum related costs. Its assessment says the impact of the naphtha shock that began in March is showing signs of having peaked. Naphtha is a petroleum product used to make chemicals and plastics, connecting oil costs to materials such as food packaging.
Manufacturers still face rising wages, logistics expenses and energy costs even when one source of pressure eases. Those overlapping expenses help explain why food price revisions continue after the largest autumn wave has passed.
Households face pressure beyond packaged food
Daikon radishes and other vegetables are also expected to remain expensive, adding pressure to fresh food purchases alongside the announced increases in manufactured products. Families planning meals therefore face higher costs across both packaged goods and fresh ingredients.
Household concern was already widespread before the latest announcements. A Cabinet Office survey discussed in rising food price concerns found that roughly 73% of adults wanted government action on rising prices, up from 66.1% in the preceding survey. The survey covered 2,729 adults between August 7 and September 14, 2025.
The effects are especially concrete for people with little money left after rent and utilities. In an earlier survey of 354 grant recipients aged 18 to 25 who also sought food assistance, 91% said inflation had worsened their livelihoods. Their experiences of students cutting food spending included balancing meals and other essential bills against the time needed for study.
Families seeking food assistance have faced similar choices. A June 2025 survey covering 7,856 households found that more than 90% struggled to reliably provide enough food. Among those households, the share reporting insufficient or nearly insufficient lunches rose from 7.7% when school meals were available to 54.5% without them, illustrating the pressure behind families reducing their meals.
Food tax relief reaches a November debate
Japan's latest price announcements arrive as lawmakers prepare to scrutinize proposed food tax relief. The House of Representatives Financial Affairs Committee is scheduled to begin deliberations on November 4 on legislation to reduce consumption tax on food from 8% to 1% for two years.
The proposal, covered in the food tax debate timetable, would take effect in April 2027. It forms part of a wider package that includes support payments to workers based on income. Whether the legislation passes and how businesses price their goods will determine the eventual effect at checkout.
For food priced at 1,000 yen before tax, moving from an 8% tax rate to 1% would reduce the checkout price from 1,080 yen to 1,010 yen if the seller kept its price before tax unchanged. That would save 70 yen, or about 6.5% of the current checkout total.
The proposed April start means November's increases arrive months before that relief could begin. Households must first manage the new prices under the current rules, while lawmakers examine the cost and design of the tax proposal and competing assistance plans.
What manufacturers may do in 2027
Teikoku Databank expects food prices to continue rising in 2027, but says the number of products affected could fall below 2026's total. After the concentration of revisions this autumn, companies may introduce changes more gradually, choosing individual products or categories rather than raising many prices together.
Bread is already an area of concern because imported wheat prices are rising. Petroleum product prices linked to Middle East conditions, labour expenses and distribution costs are also expected to keep pressure on manufacturers.
Consumers' willingness to pay more will shape company decisions. Teikoku Databank says increases that customers find hard to accept risk reducing sales volumes and damaging brands. It expects manufacturers to consider a mixture of higher prices, smaller package sizes and products intended to command higher prices.
For shoppers, a gentler pace would mean fewer new increases arriving at once. Existing price levels would still affect the grocery bill, and changes in package size would remain part of the calculation. The firm's outlook points to continued, more selective revisions rather than another autumn on the scale of 2026.
Key Points
- Japan faces 1,477 food and beverage price increases in November 2026, compared with 150 a year earlier.
- The average increase per revision is 17%, under Teikoku Databank's survey method.
- Seasonings lead with 644 affected products, followed by 417 beverages and 275 processed foods.
- The annual count has reached 20,327, exceeding 20,000 for a second consecutive year.
- Raw materials, energy and labour are the leading cost pressures.
- Lawmakers begin examining proposed food tax relief on November 4, with an intended start in April 2027.
- Teikoku Databank expects further increases in 2027, potentially at a slower pace.