
A larger export business, an even larger import bill
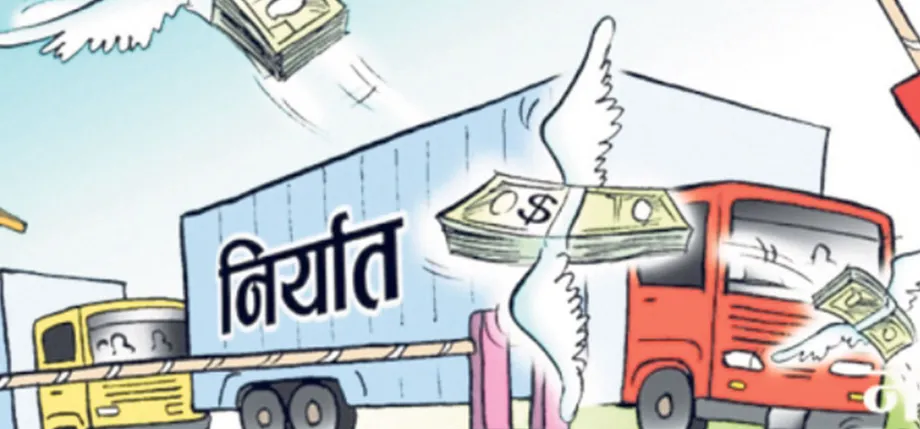
Nepal earned Rs 114.28 billion from merchandise exports between mid-July and mid-October, a rise of 57.03 percent from the same period a year earlier. Yet its trade deficit widened to Rs 532.49 billion because spending on imports increased by much more in rupee terms.
Contents
- A larger export business, an even larger import bill
- Why the deficit grew despite faster export growth
- Vegetable oil drives more than half of exports
- Argentina supplies a crucial industrial input
- Textiles, cardamom and dog chews add other earnings
- Fuel and industrial purchases lift imports
- India dominates sales while China supplies far more than it buys
- Festival demand rises as northern roads are disrupted
- Another export record depends on the remaining months
- Key Points
Department of Customs figures put imports at Rs 646.78 billion, up 38.18 percent from Rs 468.08 billion. Total trade, the combined value of goods entering and leaving the country, reached Rs 761.07 billion, an increase of 40.71 percent from Rs 540.86 billion.
Soybean oil dominated exports, earning Rs 52.60 billion, or about 46 percent of all export receipts. Nepal also imported crude soybean oil worth almost exactly the same amount, showing how closely its largest export business depends on materials purchased abroad.
India bought Rs 95.59 billion of Nepal's exports, accounting for about 84 percent of the total. Meanwhile, floods and landslides disrupted northern trade routes, and demand during Dashain helped drive a sharp increase in imports toward the end of the quarter.
Why the deficit grew despite faster export growth
Nepal's exports increased by Rs 41.50 billion, from Rs 72.78 billion a year earlier. Imports rose by about Rs 178.70 billion. The additional import spending was therefore more than four times the extra export earnings.
A trade deficit is the difference between what a country spends on imported goods and what it earns from exported goods. Because Nepal started with a much larger import bill, even a slower percentage increase in imports added far more spending than the faster percentage increase in exports generated in earnings.
The quarterly deficit consequently increased by Rs 137.19 billion, or 34.71 percent, from Rs 395.30 billion. For businesses selling abroad, the quarter brought substantial growth. For the country's merchandise trade balance, purchases from overseas continued to pull further ahead of sales.
Nepal nevertheless imported less for each rupee it earned from exports: Rs 5.66, compared with Rs 6.43 a year earlier. Exports accounted for 15.02 percent of total trade, up from 13.46 percent, an improvement of 1.56 percentage points. Imports supplied the remaining 84.98 percent, down from 86.54 percent.
Vegetable oil drives more than half of exports
Vegetable oil exports totaled Rs 59.32 billion, about 52 percent of Nepal's export earnings. Soybean oil supplied most of that amount, followed by sunflower oil at Rs 2.53 billion.
The detailed product figures put refined palm olein exports at Rs 2.42 billion, while another customs summary gives palm oil exports of Rs 3.28 billion. The figures describe the same broad export business at different reported values, without a reconciliation explaining the gap.
Nepal's oil processors buy crude vegetable oil abroad, refine it domestically and sell the processed product overseas, particularly to India. Their activity therefore appears on both sides of the trade ledger: imported raw materials create a bill before the finished oil generates export revenue.
Imports of raw materials for vegetable oil production reached Rs 66.66 billion. Individual figures included Rs 52.60 billion for crude soybean oil, Rs 3.61 billion for crude palm oil and Rs 7.02 billion for sunflower oil.
The soybean trade alone involved more than 298.48 million litres of crude oil entering Nepal and more than 217.09 million kilograms of processed oil leaving it. Litres measure volume and kilograms measure weight, so those quantities cannot be directly compared. The export receipt includes the value of the imported input as well as the processing carried out in Nepal; the domestic contribution depends on processing costs, margins and the timing of purchases and sales.
Argentina supplies a crucial industrial input
Argentina supplied nearly 169.5 million litres of crude soybean oil worth more than Rs 29.20 billion. That represented about 57 percent of the imported volume and roughly 56 percent of its value, making Argentina the leading supplier of this raw material.
Nepal's total imports from Argentina reached Rs 35.65 billion, placing it third among the country's sources of imported goods. Crude soybean oil accounted for approximately 82 percent of that amount, demonstrating how one industrial input can shape an entire trading relationship.
China, Brazil, Paraguay and Vietnam also supplied crude soybean oil. Total imports from Brazil reached Rs 9.04 billion, while imports from Saudi Arabia were Rs 11.56 billion. These purchases show that Nepal's export production draws on supply routes extending well beyond its immediate neighbours.
Textiles, cardamom and dog chews add other earnings
Yarn exports earned Rs 4.97 billion, making the category the second largest in the broad export breakdown. Tea, coffee and spices together brought in Rs 4.65 billion. More detailed figures put tea and coffee at Rs 1.68 billion and large cardamom at Rs 2.57 billion.
Carpet related exports were listed at Rs 3.72 billion in the broader category. Within the detailed product figures, hand-knotted woollen carpets earned Rs 3.32 billion from more than 96,123 square metres shipped abroad. The broader category and the specific carpet product should be kept separate when comparing export rankings.
Woven fabrics of jute and other bast fibres generated Rs 2.96 billion. Non-woven felt fabrics earned another Rs 2.37 billion, while dog chews brought in Rs 1.50 billion. These products gave Nepal export income outside the dominant vegetable oil business.
The scale difference remains large. Soybean oil exports alone were worth more than ten times yarn exports. Oil processing therefore has a much greater effect on the headline export total than movements in any of these smaller categories.
Fuel and industrial purchases lift imports
Fuel was among Nepal's largest import expenses. The broad fuel total was put at Rs 119 billion, while a separate petroleum breakdown totaled Rs 104.61 billion. The published figures do not explain the difference in coverage.
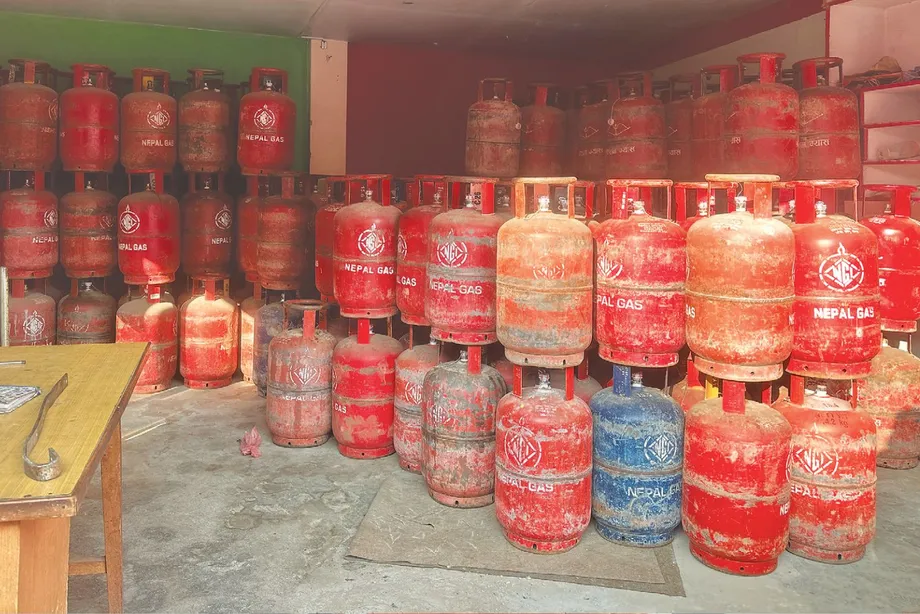
The petroleum breakdown included diesel worth Rs 47.31 billion, petrol worth Rs 24.62 billion, liquefied petroleum gas worth Rs 23.18 billion, aviation fuel worth Rs 9.32 billion and kerosene worth Rs 216 million. Diesel shipments amounted to 288,468 kilolitres, while petrol shipments reached 181,554 kilolitres. A kilolitre equals 1,000 litres.
Vehicles and spare parts cost Rs 53.19 billion. Machinery and mechanical parts added Rs 42.11 billion, electrical equipment Rs 40.84 billion, and the broad iron and steel category Rs 39.37 billion.
Fertiliser imports totaled Rs 32.75 billion. The detailed product list included fertiliser grade chemical products worth Rs 19.30 billion and diammonium phosphate, commonly called DAP, worth Rs 12.52 billion. DAP supplies nutrients used by crops and was imported largely from Saudi Arabia and Russia.
Nepal also imported 6,636 electric vehicles worth more than Rs 15.03 billion. China supplied 4,821, India 1,420 and Thailand 393. Alongside fuel and consumer goods, the import bill therefore included machinery, farm inputs and vehicles used by businesses and households.
India dominates sales while China supplies far more than it buys
India remained Nepal's largest trading partner. Nepal imported Rs 366 billion in goods from India and exported Rs 95.59 billion to it. The bilateral deficit was put at around Rs 271 billion; subtracting the published rounded import and export figures gives approximately Rs 270.41 billion.
India accounted for about 57 percent of Nepal's imports and 84 percent of its exports. Nepal's exporters consequently relied more heavily on India as a buyer than its importers relied on India as a supplier.
China was Nepal's second largest trading partner, supplying goods worth Rs 134 billion. Nepal's exports to China were only Rs 670 million, or Rs 0.67 billion. Those figures leave a merchandise trade gap of approximately Rs 133.33 billion.
The United States bought Rs 6.99 billion of Nepali goods and supplied Rs 8.93 billion, leaving a much smaller deficit of Rs 1.94 billion. Its purchases from Nepal were more than ten times China's, despite China's much larger role in supplying the Nepali market.
Smartphones illustrate China's strength as a supplier. Nepal imported 811,267 handsets worth more than Rs 18.81 billion. China supplied 701,244 of them, valued at Rs 14.56 billion, accounting for about 86 percent of the imported units.
Festival demand rises as northern roads are disrupted
Flooding and landslides closed the Rasuwagadhi and Korala customs points on the Chinese border during the quarter. Floods in the Bhotekoshi and Trishuli rivers in Rasuwa on August 26, followed by flooding and landslides along the Kaligandaki and Budhigandaki rivers, disrupted northern road transport. Highways leading to Kathmandu were also affected.
The Rasuwagadhi crossing was severely damaged by the Bhotekoshi flooding on August 26. By September 29, road access to Korala had also been cut by Kali Gandaki flooding and damage to bridges along the Beni-Jomsom road. The Korala border point and customs office remained safe, but cargo vehicles could not move along the damaged route.
Bidur Chudal, chief customs officer at Mustang Customs Office, said more than 150 cargo vehicles and containers, including vehicles awaiting customs clearance, and around 300 to 400 electric vehicles were stranded at the customs point and border. He said traders were delaying customs clearance because the road on the Nepali side was blocked, and the Department of Roads was working to repair it.
Imports still increased across the three fiscal months. The final month brought approximately Rs 245.27 billion in goods, compared with Rs 187.44 billion in the first month, a rise of about 31 percent. Customs attributed the late-quarter surge to demand during Dashain.
The quarter's sequence shows the combination of growing purchases and transport disruption:
- Shrawan, roughly mid-July to mid-August: imports reached Rs 187.44 billion, while exports grew 61.72 percent from a year earlier.
- August 26: floods in Rasuwa disrupted northern transport, with further flooding and landslides affecting other routes.
- Bhadra, roughly mid-August to mid-September: imports reached Rs 214.07 billion. Cumulative export growth over the first two months was 61.86 percent.
- Ashwin, roughly mid-September to mid-October: imports reached about Rs 245.27 billion as Dashain demand increased. Export growth for the full quarter settled at 57.03 percent.
The national totals show rising trade despite the closures. Businesses using the affected northern routes faced interrupted access even as the value of goods moving through Nepal's trading system increased.
Another export record depends on the remaining months
Nepal earned more than Rs 315 billion from merchandise exports in the previous fiscal year, setting an annual record. The latest quarter's Rs 114.28 billion amounts to roughly 36 percent of that benchmark.
Repeating the same quarterly export value four times would produce about Rs 457 billion over a full year. That is a simple calculation rather than an official forecast. Actual earnings will depend on orders, commodity prices, supplies of imported inputs and the movement of goods during the remaining months.
Export growth also eased from 61.86 percent over the first two months to 57.03 percent over the full quarter. Sales remained well above the previous year's level, but their pace of growth slowed as the quarter ended.
The central challenge is the difference in scale between overseas purchases and sales. Nepal increased its export share and earned substantially more from goods shipped abroad. To narrow the deficit in rupee terms, future gains in export earnings would need to exceed the additional spending on imports.
Key Points
- Exports rose 57.03 percent to Rs 114.28 billion between mid-July and mid-October.
- Imports increased 38.18 percent to Rs 646.78 billion, widening the trade deficit to Rs 532.49 billion.
- Nepal imported Rs 5.66 for every rupee earned from exports, down from Rs 6.43 a year earlier.
- Vegetable oils generated about 52 percent of export earnings, led by soybean oil.
- India bought about 84 percent of Nepal's exports and supplied about 57 percent of its imports.
- Dashain demand helped lift imports despite flood and landslide damage to northern trade routes.