
Record Prices Meet a Slower Market
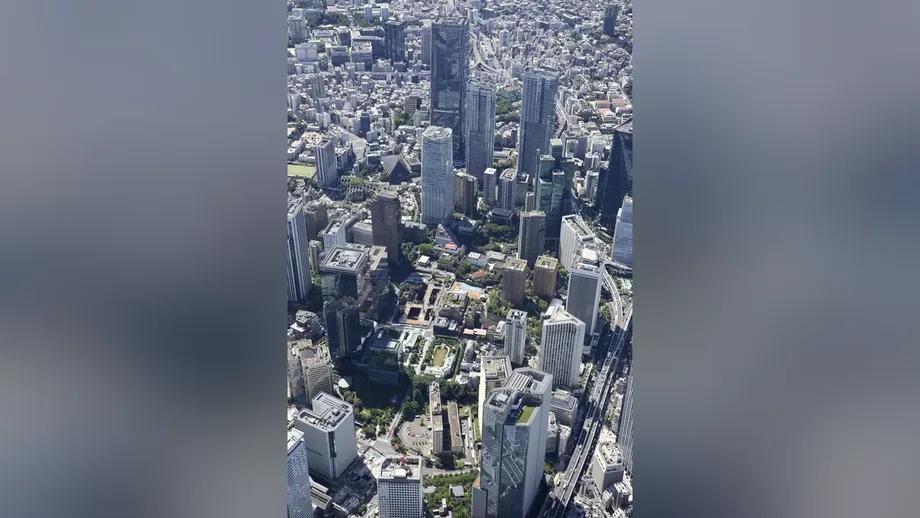
The average price of a newly launched condominium in the Tokyo metropolitan area reached ¥114.94 million in April to September 2026, up 21.1% from a year earlier, even as buyers took longer to commit and unsold inventory increased. In Tokyo's 23 wards, the average climbed 34.7% to ¥179.25 million.
Contents
- Record Prices Meet a Slower Market
- Where Prices Rose, and Where They Fell
- Why the Mix of Properties Matters
- Construction Costs Keep Pressure on Developers
- Fewer Launches, More Homes Awaiting Buyers
- September's Slowdown Reached Central Tokyo
- Higher Mortgage Rates Tighten Household Budgets
- Two Half Year Records Cover Different Months
- The Dates Behind the Shift
- Key Points
The Real Estate Economic Institute announced the figures on October 20. The regional average exceeded ¥100 million for the first time in a fiscal first half since records began in 1973. The survey covers Tokyo and the neighboring prefectures of Kanagawa, Saitama and Chiba.
Developers launched 8,601 condominiums across the region during the six months, down 6%. That was the second lowest fiscal first half total in 30 years, after fiscal 2024. Meanwhile, the number of units still available for sale reached 6,775 at the end of September, up 896 from a year earlier.
September brought a sharper slowdown. Just 50.4% of newly launched units secured contracts that month, while launches fell 40.1% from a year earlier. The regional average price also declined, although expensive construction and scarce development sites continued to put pressure on prices.
A prospective buyer in his 30s described the choices facing households. He had hoped to purchase in Tokyo's Bunkyo Ward, but found properties priced near ¥200 million, beyond his budget. He eventually bought elsewhere within the capital's 23 wards.
His experience captures the practical squeeze: buyers can change neighborhoods or reconsider their budgets, while developers face high costs even as sales become harder to secure.
Where Prices Rose, and Where They Fell
Tokyo's 23 wards recorded their fourth consecutive fiscal first half price record. Their average of ¥179.25 million was more than twice the ¥79.78 million average in the rest of Tokyo, where prices rose 15.9% from a year earlier.
Chiba recorded the next largest percentage increase after the 23 wards. Its average rose 24.1% to ¥73.76 million, with large condominium developments around Funabashi contributing to the increase. Large tower projects in Tokyo's Chuo Ward also helped lift the capital's average.
Kanagawa and Saitama moved in the opposite direction. Kanagawa's average fell 1.6% to ¥77.16 million, while Saitama's declined 2.1% to ¥64.57 million. Despite those declines, both remained expensive destinations for households priced out of central Tokyo.
The gap between the 23 wards and Saitama was ¥114.68 million per condominium, calculated from their respective averages of ¥179.25 million and ¥64.57 million. Location therefore changes the scale of a purchase dramatically, although the figures also reflect differences in the properties launched in each area.
Why the Mix of Properties Matters
The institute's figures describe newly launched condominiums. An average can rise because individual properties become more expensive, because developers launch a larger share of costly homes, or through both changes together.
Successive launches of large developments helped lift the April to September average while the total number of new units remained limited. With fewer suitable sites available, developers have concentrated on convenient locations where expensive projects can find buyers.
September showed how quickly that mix can change. The regional average fell 4.1% from a year earlier to ¥95.52 million, its second consecutive monthly decline and second consecutive month below ¥100 million. Fewer expensive properties reached the market as developers struggled to acquire land and supply in popular locations contracted.
Tokyo's 23 wards still recorded a September increase of 1.3%, taking their monthly average to ¥139.4 million. Across the wider region, the average price per square meter slipped just 0.5% to ¥1.458 million, compared with the larger 4.1% decline in the price per condominium. The average unit measured 65.50 square meters.
Those two measures help explain the market: the total purchase price depends on both the amount of space and its price per square meter. Changes in the size and location of new units can move the headline average from month to month.
Construction Costs Keep Pressure on Developers
The national construction materials price index reached 153.4 in September, about 34% higher than five years earlier. The index tracks changes in material prices, rather than the price of a completed home.
Labor costs have also risen amid worker shortages. Developers must cover those expenses alongside the cost of acquiring land, which is particularly difficult in Tokyo's densely developed central districts.
The combination helps explain why weaker sales can coexist with high asking prices. A developer facing expensive land, materials and labor has limited room to reduce a project's selling price without accepting a smaller return.
Speculative purchases and investment aimed at reselling properties may also add upward pressure. The figures do not quantify how much of the increase comes from those purchases, so their contribution remains uncertain.
The Real Estate Economic Institute expects construction and labor costs to keep prices high. Tadashi Matsuda, its senior chief researcher, has also described a market in which rising interest rates are slowing potential buyers while building costs continue to support gradual price increases.
Fewer Launches, More Homes Awaiting Buyers
Tokyo's 23 wards supplied 3,313 new condominiums in April to September, down 7.9% from a year earlier. Across the metropolitan area, the decline to 8,601 launches reduced the number of fresh choices available to buyers.
Unsold inventory nevertheless rose to 6,775 units at the end of September from 5,879 a year earlier. That is an increase of about 15.2%, calculated from the two totals. Inventory also rose by 165 units from August, marking a fourth consecutive monthly increase.
The contract rate provides another measure of demand. It is the share of newly launched condominiums that secure contracts during their launch month. For April to September, the rate was 62.8%, keeping it below 70% for a third consecutive six month period.
September's rate was weaker still at 50.4%, down four percentage points from a year earlier. It had stood at 69.5% in July and 61.1% in August. In practical terms, roughly half of September's new units secured contracts during their first month on sale.
Launch totals and inventory measure different things. Launches count homes newly offered during a period, while inventory includes units still awaiting buyers from earlier launches. A market can therefore have fewer new projects entering sale and a growing stock of unsold homes at the same time.
September's Slowdown Reached Central Tokyo
Developers launched 1,142 condominiums across the metropolitan area in September, down 40.1% from a year earlier but almost unchanged from August, when the total was two units lower. Launches fell across the survey area except in Chiba.
Tokyo's 23 wards accounted for 409 units, or 35.8% of September's regional total. Kanagawa followed with 370, while Chiba supplied 153, Saitama 115 and Tokyo outside the 23 wards 95.
The six central wards of Chiyoda, Chuo, Minato, Shinjuku, Bunkyo and Shibuya recorded just 72 launches at an average price of ¥193.07 million. A year earlier, 75 units had launched at an average of ¥203.96 million. Their average price per square meter also fell, to ¥3.023 million from ¥3.202 million.
Tower developments remained part of the market, but their supply contracted. Buildings with at least 20 stories accounted for 321 units across 13 projects, compared with 528 units across 15 projects a year earlier. Their September contract rate was 51.1%, close to the wider market's 50.4%.
The institute forecast about 1,500 launches for October 2026. That would exceed October 2025's 1,316 units but remain below the 1,833 launched in October 2024. The forecast concerns the number of homes coming to market; their prices and eventual sales will depend on the projects offered and buyer demand.
Higher Mortgage Rates Tighten Household Budgets
Major banks increased home loan rates in September and October after the Bank of Japan raised its policy rate. The benchmark rate for variable rate mortgages, used by about 80% of borrowers, rose to 3.375% annually.
A variable mortgage rate can change during the life of a loan. When the applicable rate rises, borrowing becomes more expensive, increasing repayment costs or affecting how quickly the borrower pays down the balance, depending on the loan's terms.
The benchmark is a reference rate. A household's actual borrowing rate depends on the lender's discounts and the mortgage contract. Buyers therefore need the rate offered for their own loan to assess what they can afford.
Higher prices and higher borrowing costs squeeze the same budget from two directions. A household seeking to keep repayments manageable may need a larger deposit, a cheaper property, a different location or more time before purchasing.
Matsuda said rising rates offer no benefit to the condominium market and warned that demand could weaken if prices keep climbing. His assessment fits the slower contract rates and rising inventory, even as developers continue to face expensive construction.
Developers also increased the supply of condominiums with fixed term land lease rights to 708 units in April to September, up 4%. In this arrangement, a buyer purchases the condominium while the underlying land is leased for a defined period. Land rent, the lease duration and end of term conditions become important parts of the purchase decision.
Two Half Year Records Cover Different Months
The fiscal first half figures follow another record for January to June 2026. During that calendar period, the metropolitan average reached ¥101.35 million, up 13.1% from a year earlier. Tokyo's 23 wards averaged ¥142.49 million, up 9.1%.
Chiba's January to June average reached ¥89.97 million, a rise of 56.8%, helped by expensive sales in Funabashi. Regional supply fell 0.8% to 7,989 units, marking a third consecutive January to June period below 10,000 launches.
The two half year measurements overlap from April through June, but cover different sets of months. Japan's fiscal year begins in April, so the latest release measures April to September rather than January to June. Each sets a record for its own reporting period.
Matsuda, a researcher at the Real Estate Economic Institute, had described his price outlook when discussing the January to June results:
Even if prices ease somewhat in the autumn, they are likely to remain close to ¥100 million,
September's ¥95.52 million regional average was close to that level, while the full April to September average was much higher. The sequence shows why a single month's launches can look different from the broader period.
The Dates Behind the Shift
The 2026 figures trace a progression from record prices to slower purchasing activity, with costs remaining high throughout. The main dates are:
- January to June 2026: The regional average reached ¥101.35 million, while launches totaled 7,989 units.
- April to September 2026: The fiscal first half average climbed to ¥114.94 million, with 8,601 launches and a contract rate of 62.8%.
- July to September 2026: The monthly contract rate fell from 69.5% to 61.1%, then to 50.4%.
- September 2026: The regional average fell to ¥95.52 million, while inventory reached 6,775 units.
- October 20, 2026: The institute released the latest results and forecast about 1,500 October launches.
For prospective buyers, the immediate change is a market with more unsold homes but continued pressure on affordability. For developers, the challenge is securing buyers at prices that cover costly land and construction. The next launch and contract figures will show whether the September slowdown continues.
Key Points
- New condominiums across the Tokyo metropolitan area averaged ¥114.94 million in April to September 2026, up 21.1%.
- Tokyo's 23 wards averaged ¥179.25 million, while Kanagawa and Saitama recorded modest price declines.
- Regional launches fell 6% to 8,601 units, while September inventory rose about 15.2% from a year earlier.
- September's average fell to ¥95.52 million, and only 50.4% of new units secured contracts during their launch month.
- High construction costs support prices, while rising mortgage rates put more pressure on buyers.