
A disappearing population may be changing its appearance
A study of 98 compact objects discovered with the James Webb Space Telescope suggests that the early universe's mysterious little red dots became scarce because their hosts grew toward the properties of ordinary galaxies. The strongest evidence comes from their surroundings: these objects occupy relatively sparse regions at earlier times, then appear in environments more like those of other galaxies as the universe ages.
Contents
- A disappearing population may be changing its appearance
- What makes these objects unusual?
- From 170 candidates to 98 measured environments
- The evidence lies in their neighborhoods
- Halo growth provides a second line of evidence
- A timeline of the proposed transition
- Are their black holes really too large?
- Three possible ways the red dot phase ends
- What remains unresolved
- Key Points
The study also finds a sharp increase in the mass of their dark matter halos, the invisible structures that help hold galaxies together. The paper gives a characteristic halo mass of at most about 12.6 billion solar masses at redshift 7.5, rising to about 200 billion solar masses at redshift 3.5. Those figures suggest a transition from relatively small halos toward the masses associated with more typical galaxies.
The research was led by Associate Professor Huanian Zhang and Professor Qingwen Wu of the School of Physics at Huazhong University of Science and Technology, working with collaborators at Peking University, the Chinese Academy of Sciences Institute of High Energy Physics and other institutions. Doctoral student Chenxuan Zhang is identified as the first author. Publication accounts give October 8, 2026, Beijing time, as the date the work appeared online in Nature Astronomy.
The authors' little red dots study supports an evolutionary explanation, rather than the literal disappearance of galaxies or black holes. Its conclusion is narrower than a complete solution: the environmental evidence is consistent with a brief phase of galaxy development, while the physical processes that produce and end that phase remain uncertain.
What makes these objects unusual?
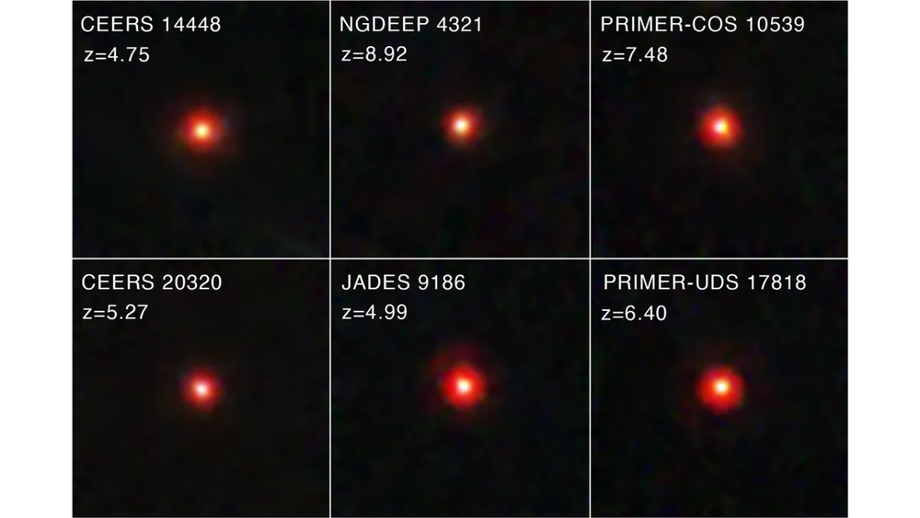
Little red dots combine unusually compact shapes with distinctive colors. Their visible structures can measure only a few hundred parsecs across, with a parsec equal to about 3.26 light years. Many remain unresolved in images from Webb's Near Infrared Camera, meaning that the telescope cannot distinguish their internal structure.
Their spectra have a distinctive V shape when plotted across ultraviolet and optical wavelengths as those wavelengths would appear at the object itself. They have blue ultraviolet slopes and steep red optical slopes, with the transition near the Balmer limit, a boundary associated with how hydrogen absorbs light. This combination, rather than red color alone, helps astronomers identify the population.
Many also show broad hydrogen emission lines with widths exceeding about 1,000 kilometers per second. If those widths reflect gas moving under the gravity of a central black hole, they imply black hole masses of roughly one million to 100 million solar masses. That interpretation is a major reason little red dots are considered possible sites of black hole growth.
Yet their appearance does not fit a single settled explanation. Dense gas could account for absorption features and missing X ray detections. Dust could redden the light, although the absence of strong direct detections of dust emission challenges a simple dust explanation. Other proposals include intrinsically red disks of material feeding black holes or dense gas surrounding the central source.
From 170 candidates to 98 measured environments
The researchers combined three catalogs into a merged sample of 170 unique little red dots spanning redshifts between 2 and 9. For the environmental and clustering analysis, they restricted that collection to 98 objects at redshifts between 3 and 7 in six deep observing fields: A2744, CEERS, GOODS South, GOODS North, COSMOS and UDS.
Redshift measures how much cosmic expansion has stretched light during its journey to Earth. A larger redshift generally means astronomers are observing an earlier period. The four analysis intervals contained 16 objects at redshifts 3 to 4, 24 at 4 to 5, 33 at 5 to 6, and 25 at 6 to 7.
Every little red dot in the final analysis had a spectroscopic redshift, measured from its spectrum rather than estimated from colors alone. The comparison galaxy catalog contained 17,636 objects, of which 727 had spectroscopic redshifts. For the rest, the researchers used estimates based on measurements through multiple filters, applying quality requirements and matching the populations' effective observing depths.
The evidence lies in their neighborhoods
To measure an object's environment, the team counted nearby galaxies within cylindrical regions centered on each little red dot. They compared the observed counts with the number expected from a random distribution that followed the surveys' coverage and depth. A count below that expectation indicates a relatively sparse environment.
The analysis used a velocity interval of plus or minus 2,500 kilometers per second along the viewing direction. The limited size of the observing fields restricted the maximum projected radius to about five inverse h comoving megaparsecs. Comoving distances account for cosmic expansion, allowing researchers to compare large structures across different epochs.
At redshifts above 4, little red dots had lower surrounding galaxy densities than the comparison galaxies across the measured radii. At redshifts between 3 and 4, their environments became comparable. This does not mean that every early little red dot was alone. It means that, as a population, they occupied less crowded neighborhoods than ordinary galaxies observed during the same periods.
The team tested sensitivity to survey coverage by excluding the relatively shallow UDS field and found that its main results persisted. It also estimated uncertainties by repeating the analysis while leaving out one observing field at a time. These checks help assess whether a particular patch of sky is driving the result.
Halo growth provides a second line of evidence
The researchers also measured how frequently little red dots appeared near galaxies at different separations. This clustering analysis provides a statistical estimate of the mass of their host dark matter halos. It is not a direct weighing of individual objects, and halo mass should not be confused with the mass of either the stars or the central black hole.
The paper reports halo masses of at most 10 to the power of 10.1 solar masses at redshift about 7.5 and about 10 to the power of 11.3 solar masses at redshift about 3.5. These correspond to approximately 12.6 billion and 200 billion solar masses. The difference between the quoted mass scales is about a factor of 16, or more if the earlier mass is below its stated limit.
Publication accounts round the earlier value to 10 billion solar masses and describe growth to 200 billion, a factor of 20. The distinction reflects the rounded figures and the paper's upper limit at the earlier epoch. The paper also places its earliest quoted mass scale at redshift 7.5, outside the redshift 3 to 7 interval of the 98 objects used for the main environmental analysis.
At earlier epochs, little red dots occupy less massive halos than the comparison galaxies. By redshift about 3.5, the inferred masses approach those of typical galaxies and less luminous active galactic nuclei. The agreement between the density measurements and the halo estimates makes the evolutionary interpretation more persuasive, although it does not establish the history of each individual object.
A timeline of the proposed transition
The observations compare populations seen at different cosmic ages. They do not follow the same galaxy through a billion years of growth. That distinction matters: the evidence describes a population trend from which the researchers infer a possible evolutionary sequence.
- At a cosmic age of roughly 800 million years, publication accounts place the earlier halo mass scale near 10 billion solar masses.
- At redshifts above 4, the analyzed little red dots preferentially occupy sparse environments and appear to have unusually massive black holes relative to their hosts.
- At a cosmic age of roughly 1.8 billion years, publication accounts place the later halo mass scale near 200 billion solar masses.
- At redshifts 3 to 4, their environments resemble those of ordinary galaxies more closely.
- Below redshift 3, broadly corresponding to a universe older than about two billion years, little red dots become much less common.
This sequence supports the idea that the visible little red dot phase can end without the underlying object disappearing. A growing galaxy may cease to satisfy the compactness and color criteria used to recognize the class.
Are their black holes really too large?
The study connects halo growth with another puzzle: at redshifts above 4, the inferred black holes appear unusually massive relative to their host galaxies' stars. To examine that relationship, the team estimated average stellar masses using UniverseMachine, an empirical model that relates stellar mass to halo mass.
At redshift about 3.5, the relationships between black hole mass, stellar mass and halo mass lie closer to those measured in nearby galaxies, although differences remain. One interpretation is that black holes gained mass early while their hosts subsequently built up more stars and larger halos.
There are two substantial uncertainties. First, the UniverseMachine relation may not accurately describe objects whose physical nature is still disputed. Second, black hole masses are estimated from broad emission lines under the assumption that the gas motions mainly reflect gravity. Scattering by electrons in dense ionized gas could also broaden those lines.
If the line widths do not mainly trace gravitational motion, the black hole masses could be overestimated by about one dex, meaning a factor of ten. The authors state that even such a reduction would leave the objects at redshifts above 4 above the nearby relationship between black hole mass and halo mass. That makes the apparent mismatch worth investigating, while leaving its precise size uncertain.
Three possible ways the red dot phase ends
The study offers several possible mechanisms, without selecting one as proven. The authors describe a hypothesis involving the rotation of the host halo:
One plausible explanation is that the LRD phase is linked to special halo conditions, such as low halo spins, that become less common or less easily maintained at later times.
Halo spin refers to the angular momentum of the dark matter structure. If little red dots require a particular set of halo conditions, their declining abundance could reflect those conditions becoming harder to preserve as galaxies develop.
A second possibility concerns appearance. As hosts gain stellar mass, increase in size and undergo stronger star formation, their combined light may move outside the color criteria used to select little red dots. The population would then become harder to recognize as a distinct class, even if some central activity continued.
A third possibility is the loss of dense gas. If that gas helps sustain compact, obscured black hole growth or star formation, its depletion could change the object's spectrum and appearance. Halo growth and changing surroundings are consistent with these possibilities, but neither measurement identifies which process dominates.
What remains unresolved
Scarcity is not the same as complete extinction. The study discusses three nearby analogs at redshifts around 0.1 to 0.2, identified through spectral similarities, compact shapes and spectroscopic properties. Their surroundings were examined using galaxy catalogs that included the Dark Energy Spectroscopic Instrument Data Release 1 and Sloan Digital Sky Survey Data Release 12.
Those rare objects extend the environmental comparison toward the nearby universe. They do not demonstrate that the early population survived unchanged. They also caution against treating little red dots as a class that became entirely impossible after a specific cosmic age.
The central observational limit is that the main environmental analysis contains too few little red dots below redshift 3 to study the decline directly in the same detail. Its explanation rests on the trend toward more ordinary environments and halo masses before that decline, together with the population's known scarcity at later times.
The research therefore provides a coherent explanation for why the distinctive objects become uncommon, rather than a final account of their internal physics. More secure stellar masses, better tests of what broadens their emission lines and stronger measurements of the later population are needed to distinguish growth, changing appearance and gas depletion. No specific date for resolving those uncertainties is given.
Key Points
- The main analysis covers 98 spectroscopically confirmed little red dots across six deep observing fields.
- Above redshift 4, they occupy sparser environments than ordinary comparison galaxies.
- At redshifts 3 to 4, their surroundings become more similar to those of other galaxies.
- The paper reports halo mass scales rising from at most about 12.6 billion to about 200 billion solar masses across its quoted epochs.
- The findings support a temporary phase that ends as hosts develop, rather than the literal disappearance of galaxies.
- Black hole masses, stellar masses and the physical mechanism ending the phase remain uncertain.