

Food prices bring inflation closer to the RBI ceiling
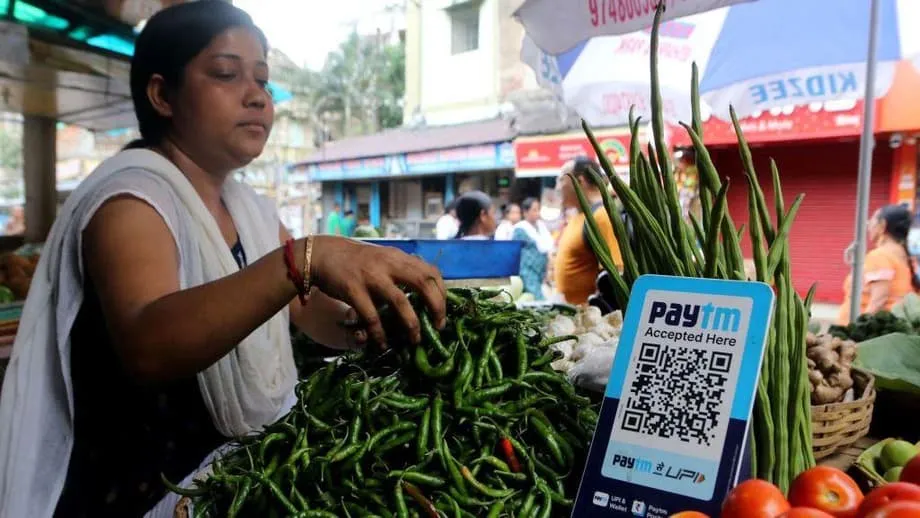
India's retail inflation accelerated to 5.54% in September 2026, while food inflation reached 7.74% and onion prices more than doubled compared with a year earlier. The provisional figures, released by the Ministry of Statistics and Programme Implementation on October 12, put national inflation just 0.46 percentage points below the Reserve Bank of India's 6% upper tolerance limit.
Contents
- Food prices bring inflation closer to the RBI ceiling
- Prices rose during September, not just against last year
- Onions lead a sharply divided food basket
- Rural households face a larger increase
- Tamil Nadu tops the large state rankings
- Freight, restaurants and precious metals add pressure
- Weather and imported costs complicate the outlook
- The RBI has shifted toward tighter policy
- A new CPI series requires careful comparisons
- The next tests are crop arrivals and October data
- Key Points
The increase from August's revised 4.83% extended a steady rise through 2026. Inflation has climbed every month since January, when it stood at 2.74%, and has exceeded the RBI's 4% target for four consecutive months. September's reading was 0.71 percentage points higher than August's, equivalent to 71 basis points.
The pressure was uneven. Rural inflation reached 6.08%, compared with 4.88% in urban areas. Tamil Nadu recorded headline inflation of 6.81% and food inflation of 10.62%, the highest readings among states with populations exceeding 5 million.
The release followed the RBI's October 7 decision to raise its benchmark repo rate by 25 basis points to 5.50%. Food shortages, expensive oil and a weaker rupee are now testing whether that increase will be sufficient to contain price pressures without placing greater strain on households and borrowing.
Prices rose during September, not just against last year
The combined Consumer Price Index rose from 108.74 in August to 109.49 in September, an increase of approximately 0.69% during the month. That matters because the headline inflation rate measures prices against the same month a year earlier, rather than against the previous month.
A low comparison level can make annual inflation rise even without a large fresh increase in prices. This is known as a base effect. September's increase in the index itself shows that the deterioration was not simply a statistical consequence of unusually subdued prices in 2025.
Sujan Hajra, chief economist at Anand Rathi Group, pointed to the sequential increase in food prices as evidence that the latest acceleration was not entirely attributable to the base effect. The annual food inflation rate rose by 1.77 percentage points, from 5.97% in August to 7.74% in September.
The headline figure also fell between two survey forecasts. A poll of 41 economists conducted from October 5 to 7 projected 5.40%, with estimates ranging from 4.90% to 5.90%. A separate survey of 19 economists forecast 5.6%. September therefore exceeded the first forecast by 0.14 percentage points but was slightly below the second.
Onions lead a sharply divided food basket
Onion inflation jumped to 108.09% from 48.78% in August. The September reading means onion prices were slightly more than twice their level a year earlier. It does not mean they doubled between August and September, a distinction that applies to all the annual item inflation figures.
Garlic inflation increased to 54.62% from 43.60%, while lemon inflation rose to 36.41% from 15.15%. Ginger inflation eased from 73.82% to 62.85%, although that still represented a substantial increase compared with September 2025.
Some vegetables remained cheaper than a year earlier. Potato prices were down 11.50%, tomato prices fell 8.62%, and prices of lady's finger and coconut declined by 4.48% and 3.99%, respectively. These declines did not prevent food inflation from accelerating.
Tomatoes also illustrate how a falling price category can add to upward pressure on the annual inflation rate. Their annual decline narrowed from 31.09% in August to 8.62% in September. Potato deflation narrowed from 13.15% to 11.50%. Prices remained below the previous year's levels, but the relief measured by those annual comparisons became smaller.
Madan Sabnavis, chief economist at Bank of Baroda, attributed much of the food pressure to dwindling stocks before the new crop season. He said:
As of now higher inflation is mainly due to depletion of earlier stocks as we head to the new season. Crop arrivals are hence important,
His assessment makes the timing and volume of incoming harvests a central factor in the next inflation readings. The figures establish the price increases, but do not quantify how much each reflects weather damage, stock depletion or transport costs.
Rural households face a larger increase
Rural headline inflation rose from 5.24% in August to 6.08% in September, an increase of 0.84 percentage points. Urban inflation increased by 0.57 percentage points, from 4.31% to 4.88%. The gap between the two widened from 0.93 to 1.20 percentage points.
The food figures show a similar divide. Rural food inflation reached 8.06%, up from 6.17%, while urban food inflation climbed to 7.18% from 5.64%. Rural food inflation was therefore 0.88 percentage points above the urban rate in September, compared with a gap of 0.53 points in August.
The wider food and beverages division recorded inflation of 7.36%, with rural and urban readings of 7.71% and 6.75%. That division is a different measure from the Consumer Food Price Index, so its figures should not be treated as interchangeable with the 7.74% national food inflation rate.
Rural inflation above 6% does not mean the national inflation measure breached the RBI's ceiling. The national combined reading remained at 5.54%. It does show that households in different locations faced substantially different rates of price increases.
Tamil Nadu tops the large state rankings
Among states with populations exceeding 5 million, Tamil Nadu recorded the highest headline inflation at 6.81%. Odisha followed at 6.70%, Madhya Pradesh at 6.68%, Telangana at 6.64% and Andhra Pradesh at 6.29%. These were all above the national reading.
Tamil Nadu's food inflation of 10.62% was 2.88 percentage points higher than the national food rate. Andhra Pradesh, Odisha, Karnataka and Maharashtra were also among the five states with the highest food inflation, although individual food rates for those states were not specified.
Other major state headline readings included Uttar Pradesh at 6.08%, Karnataka at 5.86%, Rajasthan at 5.71% and Maharashtra at 5.18%. Tamil Nadu's headline rate was 1.63 percentage points above Maharashtra's, showing how a single national figure can conceal sizeable regional differences.
The population threshold matters when reading the rankings. The comparison identifies the highest rates among larger states, rather than establishing a complete ranking of every state and Union Territory. The figures also do not, by themselves, establish the reasons for each state's position.
Freight, restaurants and precious metals add pressure
Inflation was not confined to vegetables. Restaurants and accommodation services recorded a rate of 9.36%, up from 8.38% in August. Transport inflation rose from 4.60% to 5.01%. Within transport, services for goods registered inflation of 14.73%, while personal transport inflation stood at 7.46%.
Freight costs matter beyond the transport category because food and other goods must be moved to markets. Higher shipping and distribution expenses can affect retail prices, although the September release does not calculate how much of the increase in food prices came through this channel.
The personal care, social protection and miscellaneous goods and services division had the highest inflation among the 12 major divisions, at 13.75%. Its rate nevertheless eased from 15.17% in August. Silver jewellery inflation also slowed, from 106.81% to 87.80%, while remaining exceptionally high.
Other categories showed more moderate increases. Education services inflation was 3.94%, clothing and footwear 3.93%, furnishings and household equipment 3.11%, and housing, water, electricity, gas and other fuels 2.74%. Information and communication recorded 2.44%, recreation, sport and culture 2.16%, and health 1.40%. Paan, tobacco and intoxicants stood at 4.80%.
ICRA estimated core inflation at 4.6%, compared with 4.16% in August. Core inflation excludes food and fuel to help assess less volatile price pressures. This was the rating agency's estimate, distinct from the ministry's headline CPI reading. The RBI projected core inflation averaging 4.4% for the financial year ending March 2027.
Weather and imported costs complicate the outlook
The inflation rise comes amid deficient southwest monsoon rainfall and El Niño conditions, raising concerns about crop output and reservoir supplies. The India Meteorological Department's figures put rainfall during June to September at its lowest in more than a decade, the fourth lowest since 2001 and the thirteenth driest since 1901.
Severe drought conditions were reported in parts of Maharashtra, Andhra Pradesh, Punjab and Haryana. Low reservoir levels also create risks for the rabi harvest, the crop season that follows the monsoon. New kharif crop arrivals may ease some immediate shortages, but weak water availability could prolong agricultural uncertainty.
Energy costs create a separate pressure. Brent crude remained above $100 a barrel amid the conflict involving the United States and Iran and risks to shipments through the Strait of Hormuz. Some reports put Brent above $103, after an increase of 12% to 14% during October.
India's heavy dependence on imported oil makes both the international price and the exchange rate relevant. The rupee had fallen around 7% against the dollar, increasing the domestic cost of purchases priced in dollars. Higher oil prices can affect freight and production costs even before their full effect reaches retail fuel prices.
The RBI has said healthy foodgrain buffers and government measures could cushion some weather related pressure. The scale of that relief is not yet established, and expensive energy and poor rainfall remain separate risks that a higher interest rate cannot directly resolve.
The RBI has shifted toward tighter policy
The October 7 increase took the repo rate from 5.25% to 5.50%, the first rise since February 2023. The repo rate is the benchmark at which the RBI lends to banks. Changes can influence borrowing costs, including loans with floating interest rates, although the timing depends on each loan's terms.
The central bank adopted a stance of calibrated tightening after reducing rates by a cumulative 125 basis points in 2025 and holding the rate at 5.25% for four reviews. Governor Sanjay Malhotra indicated that the next action could be a hike or a pause, with rate cuts off the table in the near term.
The RBI raised its inflation forecast for the financial year ending March 2027 from 5.0% to 5.2%. Its projections were 4.9% for the September quarter, 6.0% for the December quarter and 5.7% for the March quarter. Inflation was projected at 5.6% in the first quarter of the following financial year. Malhotra said it could average nearly 5.8% over the next three quarters.
Upasna Bhardwaj, chief economist at Kotak Mahindra Bank, expected inflation to exceed 6% in the coming months and anticipated further tightening. She said:
We expect an additional 50bp of repo rate hike, with upside risks likely if geopolitical risks do not subside,
Other forecasts pointed in the same direction. Alexandra Hermann Prasad of Oxford Economics expected increases of 25 basis points in December and February, while Garima Kapoor of Elara Securities forecast two more increases by the end of March 2027. These are economist forecasts, not announced RBI decisions.
A new CPI series requires careful comparisons
The September release uses a CPI base year of 2024, replacing 2012 and updating the consumption basket using spending patterns from the 2023 to 2024 Household Consumption Expenditure Survey. A new base year changes the reference point and can also change the importance assigned to different purchases.
Historical CPI calculations on the 2024 basis put October 2024 inflation at 6.21%, making September 2026 the highest reading since then. Reports nevertheless describe the latest result differently, calling it a 21, 22 or 23 month high. The most precise description is that it was the highest since October 2024 on that reconstructed series, and the highest so far in 2026.
There are also differences in the previous year's comparison. The reconstructed 2024 series gives September 2025 inflation as 1.41%, while another report cites 1.54%. Those figures should not be treated as equivalent without identifying the series used. Food inflation of 8.39% in December 2024 was measured on the older 2012 basis, so comparisons with September's 7.74% require the same caution.
August's headline rate was initially reported as 4.82% and subsequently revised to 4.83%. Using the revised figure gives September's increase of 71 basis points. Reports citing 4.82% reflect the earlier number.
The ministry collected prices from 1,407 urban markets and 1,465 villages across states and Union Territories, reporting a 100% response rate in both rural and urban markets for September. The release remains provisional despite that complete response.
The next tests are crop arrivals and October data
Devendra Pant, chief economist at India Ratings and Research, expected October inflation to be around 6%, partly because of an adverse base effect. Rajeev Sharan, head of research at Brickwork Ratings, expected inflation around 5.5% to 6.5% in coming months and warned that sticky food prices combined with rising rates could strain household budgets and loan servicing.
Growth forecasts remain comparatively strong. The RBI and World Bank projected growth of 7.1% for the financial year ending March 2027, while the Asian Development Bank projected 7.0% in its September Asian Development Outlook. Growth in the June quarter was 7.8%. These forecasts do not remove the pressure on consumers, but they frame the RBI's task: containing inflation while avoiding an unnecessarily sharp slowdown.
The immediate sequence is:
- January 2026: Headline inflation stood at 2.74% under the new CPI series.
- June 2026: Inflation reached 4.38%, beginning four consecutive months above the RBI's 4% target.
- October 7: The RBI raised the repo rate to 5.50%.
- October 12: The ministry released provisional September inflation of 5.54%.
- November 12: October 2026 CPI inflation data is scheduled for release.
- December: Economists expect the next monetary policy review to consider further tightening.
No further rate increase has been decided. The next release will show whether incoming crops provide relief, whether transport and services inflation continues to accelerate, and how much the low comparison base lifts the annual rate.
Key Points
- September retail inflation rose to a provisional 5.54%, from a revised 4.83% in August.
- Food inflation reached 7.74%, with onion prices up 108.09% from a year earlier.
- Rural inflation was 6.08%, compared with urban inflation of 4.88%.
- Tamil Nadu led states with populations exceeding 5 million, with headline inflation of 6.81% and food inflation of 10.62%.
- The RBI raised its repo rate to 5.50% on October 7 and projected annual inflation of 5.2% for the financial year ending March 2027.
- Further rate increases remain forecasts, not decisions. October inflation data is due on November 12.