
A 75 percent pollution cut reveals more warming
A roughly 75 percent reduction in sulfur dioxide emissions across East Asia, driven largely by China, likely contributed to faster global warming since around 2010, according to research published on 14 July 2025. Simulations from eight Earth System Models estimate that the cleanup produced a global temperature increase of 0.07 ± 0.05°C by removing particles that had partly shielded the planet from sunlight.
Contents
- A 75 percent pollution cut reveals more warming
- How cleaner air lets more sunlight through
- What satellites and emissions records show
- How the team separated the cleanup effect
- How much of the acceleration could it explain?
- Pacific warming and rainfall extend the effects
- Cloud uncertainty limits a precise verdict
- A temporary acceleration, not temporary warming
- Asia faces rising heat and a financing gap
- Key Points
The finding in Communications Earth & Environment does not mean cleaner air is undesirable. It means pollution had been masking some of the warming caused by greenhouse gases. Removing that pollution brings major health benefits while exposing more of the heat associated with accumulated emissions.
The published research paper estimates that East Asian aerosol reductions could have added up to 0.05 ± 0.04°C per decade to the global warming rate over 2010–2023. The authors treat their attribution estimate as an upper limit, rather than a precise measurement of how much recent warming the cleanup caused.
The regional consequences are larger than the small global average might suggest. Simulated seasonal warming approaches 1°C in parts of eastern and northern China, with warming also extending across the North Pacific and, in winter, into North America and the Arctic.
Bjørn H. Samset, the study's lead author and a senior researcher at CICERO Centre for International Climate Research, described the central result:
Our main result is that the East Asian aerosol cleanup has likely driven much of the recent global warming acceleration and also warming trends in the Pacific.
How cleaner air lets more sunlight through
Sulfur dioxide released by power plants and factories helps form sulfate aerosols, tiny particles suspended in the atmosphere. These particles scatter incoming sunlight. They also affect clouds, changing how much sunlight clouds reflect and sometimes how long they persist.
Reducing sulfur dioxide therefore removes part of a cooling influence. The study describes this as an unmasking of greenhouse gas driven warming, rather than a new source of greenhouse gases.
Daniel Westervelt, a study coauthor and associate research professor at Columbia University's Lamont-Doherty Earth Observatory, explained the mechanism in the university's research announcement:
Many aerosol particles emitted from human activity reflect incoming sunlight and have a surface cooling effect. As their concentrations decrease in the atmosphere, our research shows that can play a leading role in recent warming.
The paper cites an assessment that human aerosol emissions had cooled the global surface by about 0.4°C in 2019 relative to conditions before industrialization. That figure concerns the combined historical influence of aerosols, not the warming attributable to China's recent cleanup.
The health stakes remain substantial. Columbia's announcement states that ambient air pollution is responsible for more than one million deaths annually in China. The research therefore points to a need to reduce greenhouse gases alongside air pollution, not to preserve harmful pollution as a cooling measure.
What satellites and emissions records show
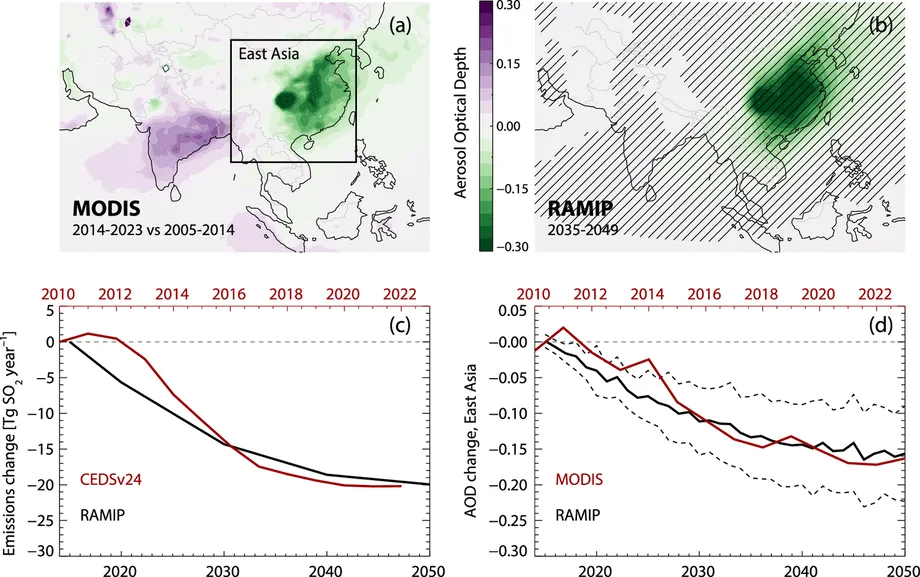
The researchers compared observations with simulations using updated pollution records. The December 2024 release of the Community Emissions Data System captured a sustained East Asian sulfur dioxide emissions reduction of about 20 million tonnes per year since around 2010.
Satellite measurements from the MODIS instruments aboard Terra and Aqua showed that East Asian aerosol optical depth fell by 0.13 units between the 2005–2010 baseline and 2014–2023. Aerosol optical depth measures how strongly airborne particles obstruct light passing through the atmosphere. It is not a direct measure of the pollution concentration people breathe at street level.
The satellite pattern was geographically uneven: aerosol loading declined strongly over China while increasing over India. This matters because the climate effect depends on where particles are emitted and on the clouds and atmospheric circulation around them.
In the simulations, reduced aerosol loading increased incoming solar radiation at the surface across East Asia by 7.7 ± 2.5 watts per square metre. The models produced an average aerosol optical depth decline of 0.11 ± 0.05 units, broadly matching the observed reduction, although individual models differed considerably.
How the team separated the cleanup effect
The Regional Aerosol Model Intercomparison Project, known as RAMIP, allowed researchers to isolate emissions changes in a particular region. They compared a baseline with weak air quality policies against simulations in which East Asian aerosol emissions followed a stronger pollution control trajectory.
The experiment used eight Earth System Models, each with 10 ensemble members, giving 80 realizations. Ensemble members are repeated simulations with different starting conditions. They help distinguish a response to changing emissions from natural fluctuations that can temporarily warm or cool the climate.
There is an important timing limitation. The simulations run from 2015 to 2049, but their older emissions assumptions place the East Asian cleanup later than it actually occurred. Researchers therefore used the simulated response during 2035–2049 as a proxy for the real emissions reduction over approximately 2010–2023.
Those future simulation dates are not a prediction that the estimated 0.07°C warming will first arrive in the 2030s. They identify the model period with an emissions difference comparable to the cleanup already observed.
The authors assume that the full warming response to the recent reduction has already occurred when comparing the simulations with historical temperatures. Other modeling indicates that much of the response develops within about two years, with a smaller component evolving more slowly. This assumption is one reason the authors label their attribution estimate an upper limit.
How much of the acceleration could it explain?
The paper calculates an observed global warming rate of 0.18 ± 0.02°C per decade during 1980–2009. For 2010–2023, it finds 0.33 ± 0.17°C per decade, falling to 0.25 ± 0.06°C per decade after filtering the influence of fluctuations between years.
The uncertainty ranges for these observed trends are 95 percent confidence intervals. By contrast, the ± 0.05°C attached to the modeled temperature response describes the spread among the eight models. The two types of uncertainty should not be read as interchangeable.
A simple comparison shows why the aerosol result matters. Adding the estimated cleanup contribution of 0.05°C per decade to the earlier 0.18°C rate gives 0.23°C per decade, close to the filtered recent rate of 0.25°C. This calculation assumes that the underlying greenhouse gas driven warming rate has not changed.
It does not establish that East Asian cleanup explains every part of the acceleration. Other aerosol changes, including shipping emissions reductions beginning in 2020, may also contribute. Changes in cloud cover, solar activity and volcanic effects have been discussed as possible influences on recent temperature records.
The research history also shows a change in wording. The February 2025 preprint said the cleanup could explain a majority of the warming acceleration. The July journal publication describes it as sufficient to be a main driver. Both versions report the same central global temperature response, 0.07 ± 0.05°C.
Pacific warming and rainfall extend the effects
The modeled warming is not confined to China. In both summer and winter, much of the North Pacific shows warming greater than 0.2°C that meets the study's statistical significance test. Winter warming also extends into North America and across the Arctic.
Observed acceleration has a partly similar Pacific pattern, with one maximum near the East Asian coast and another near western North America extending into the central ocean. That resemblance supports the proposed connection, but does not prove that aerosol reductions caused the entire observed pattern.
The Pacific Decadal Oscillation is a major caveat. This natural pattern of ocean temperature variability changed substantially during the study period and can strongly influence a trend measured over only 13 years.
The simulations also produce an increase in global average precipitation of 0.009 ± 0.004 millimetres per day, about 0.3 ± 0.1 percent. Relative to the associated temperature response, the estimated precipitation sensitivity is 4 ± 2 percent per degree of warming.
Regional changes include more summer rainfall in eastern China and along the East Asian coast, as well as wetter conditions along North Pacific storm tracks toward North America. A northward movement of the tropical rain belt also appears. Rainfall results are less geographically robust than temperature results because precipitation has greater natural variability and larger differences among models.
Cloud uncertainty limits a precise verdict
The models agree more closely on the direction of the average response than on its size. One model produces about 0.15°C of global warming, while another produces slight cooling of about 0.02°C. The paper connects much of this spread to how models represent aerosol effects on North Pacific clouds and warming in the Arctic.
Jayanarayanan Kuttippurath, an associate professor at the Indian Institute of Technology, Kharagpur's Centre for Ocean, River, Atmosphere and Land Sciences, was not involved in the study. He explained why aerosol effects remain difficult to calculate:
Cloud-aerosol interaction is important but difficult to accurately simulate for study purposes.
The simulations estimate an increase of 0.06 ± 0.04 watts per square metre in the planet's energy imbalance at the top of the atmosphere. This imbalance is the difference between incoming solar energy and energy leaving Earth. A positive change means more energy is being retained.
The NASA hosted paper also gives an effective radiative forcing estimate of 0.06 to 0.21 watts per square metre. That measures the change in the planetary energy budget caused by the emissions reduction after rapid atmospheric adjustments, rather than the later temperature response. Neither energy measure should be confused with the much larger local increase in sunlight reaching the East Asian surface.
A temporary acceleration, not temporary warming
Study coauthor Laura Wilcox, an associate professor at the University of Reading's National Centre for Atmospheric Science, distinguished the short atmospheric lifetime of air pollution from the lasting effect of carbon dioxide:
The climate effects of air pollution are short-lived, while the impact of carbon dioxide emissions can be felt for centuries.
Wilcox said the acceleration associated with pollution removal is likely to be temporary. Once aerosol concentrations stabilize, this additional push to the warming rate should weaken. That does not mean temperatures will return to their earlier level or that greenhouse gas driven warming will stop.
The emissions inventory suggests that less than 10 million tonnes of East Asian sulfur dioxide emissions per year remain to be reduced, approximately 25 percent of the 2010 level. The rate of reduction has already slowed markedly. This limits the scope for repeating a cleanup of the same size, although it does not establish an exact date when the acceleration will end.
The sequence of observations and publications is:
- 1980–2009: Global temperatures warmed at an estimated 0.18°C per decade.
- Around 2010 onward: East Asian sulfur dioxide emissions fell sharply as air quality policies strengthened.
- 2014–2023: Satellite observations showed aerosol optical depth 0.13 units below the 2005–2010 baseline.
- 19 February 2025: The research preprint was posted.
- June 2025: The World Meteorological Organization published State of the Climate in Asia 2024.
- 14 July 2025: The aerosol study appeared in Communications Earth & Environment.
Asia faces rising heat and a financing gap
The World Meteorological Organization's State of the Climate in Asia 2024 report says Asia is warming twice as fast as the global average. Its large landmass helps explain that difference because land warms faster than the ocean. The report also records exceptionally high sea surface temperatures in the Indian and Pacific oceans in 2024.
Those findings describe a broader regional climate trend. The aerosol study does not establish that China's cleanup caused all of Asia's faster warming or particular heatwaves, cyclones or floods.
Roxy Mathew Koll, a scientist at the Indian Institute of Tropical Meteorology in Pune, said warming across Asia, especially the Indian subcontinent, had risen sharply over recent decades:
This acceleration is already intensifying heatwaves, disrupting monsoons, fueling cyclones, raising sea levels, and melting glaciers.
The growing exposure comes alongside a large funding shortage. An International Monetary Fund paper estimates that emerging and developing Asia needs at least US$1.1 trillion annually for climate mitigation and adaptation, with an investment shortfall of US$800 billion. On those figures, roughly 73 percent of the estimated need is unmet.
At COP29 in Baku in November 2024, wealthy countries committed to help raise US$300 billion annually by 2035 for climate action in developing countries. That commitment covers a wider group of countries than the Asian financing estimate and has a different deadline, so the two figures are not directly interchangeable.
US moves in 2025 to withdraw from the Paris Agreement and dismantle its International Climate Finance Plan added uncertainty. The announced US withdrawal from Just Energy Transition Partnerships in March affected more than US$3 billion in commitments to Vietnam and Indonesia.
Albert Salamanca, a senior research fellow at the Stockholm Environment Institute and head of the Adaptation Research Alliance secretariat, called for stronger emissions cuts and support for communities with limited responsibility for historical emissions. The research gives that policy challenge a specific physical basis: cleaner air can reveal additional warming even as it reduces illness, making simultaneous greenhouse gas reductions more urgent.
Key Points
- East Asian sulfur dioxide emissions fell by about 75 percent, largely through China's pollution controls.
- Eight climate models estimate a global warming response of 0.07 ± 0.05°C.
- The estimated contribution to warming acceleration is an upper limit, with cloud behavior and natural Pacific variability major uncertainties.
- The simulations show warming beyond China, including the North Pacific, North America and the Arctic.
- The added acceleration should weaken as pollution levels stabilize, but greenhouse gas driven warming continues.
- Cleaner air remains a major public health benefit, while Asia faces rising climate risks and a large financing shortfall.