
Nearly 5,000 objects, 99 countries and a button marked Home
Nearly 5,000 artefacts from 99 countries appear across a digital map created by Ruixian, a Chinese designer and Massachusetts Institute of Technology graduate. An animation shows when the British Museum acquired them. Press a button marked Home, and the objects travel across the screen to their countries of origin.
Contents
- Nearly 5,000 objects, 99 countries and a button marked Home
- A museum visit becomes an interactive journey
- The audience sees both homecoming and a debate
- From graphic design to computational storytelling
- Why an opera map took three months
- Poetry becomes a landscape of sound and movement
- Autumn, mythical creatures and everyday curiosity
- The work that remains with the creator
- Key Points
Egypt's Rosetta Stone and Eye of Horus are among the examples. Others include an Olmec serpentine mask from Mexico, Islamic calligraphy from Iran and Chinese works associated with the Eastern Jin painter Gu Kaizhi. Each glowing point opens a story about an object's origins, its arrival at the museum and where it is displayed.
The project, whose video spread widely online in March, turns an enormous collection into something viewers can follow in a minute: objects travelling away from home, then making an imagined journey back.
Ruixian, the creator of the application, explained its purpose in the accompanying video:
This is not merely a cold, data-driven project; behind every glowing point lies a story of separation from home.
The museum map is part of a much wider body of work. Ruixian has mapped mythical creatures, Chinese poetry, regional opera, crops and the movement of autumn colours. His projects have attracted more than 300,000 followers and over 3 million likes across social platforms.
His method combines research, visual design and what is often called vibe coding: describing a desired program to an artificial intelligence system, then working with the code it produces. The computer helps build the experience. Ruixian decides which stories deserve a place within it.
A museum visit becomes an interactive journey
London supplied the original question. Ruixian arrived in Britain in 2008, aged 18, to study graphic design at Central Saint Martins. During repeated visits to the British Museum, he wondered how many countries its objects came from and why they were there.
Years later, his own experience of studying overseas gave the question an emotional shape. He imagined the objects as travellers with hometowns and histories of crossing the sea.
The application lets users see artefacts as cards positioned in their countries of origin. Its acquisition animation adds time to geography, showing when objects entered the British Museum. The Home button then reverses the direction of travel.
Ruixian described that feature in his video:
I have also incorporated an animation feature that visualises the timeline of when each artefact was acquired by the British Museum; naturally, a simple tap of the 'Home' button allows you to watch them return to their respective native lands.
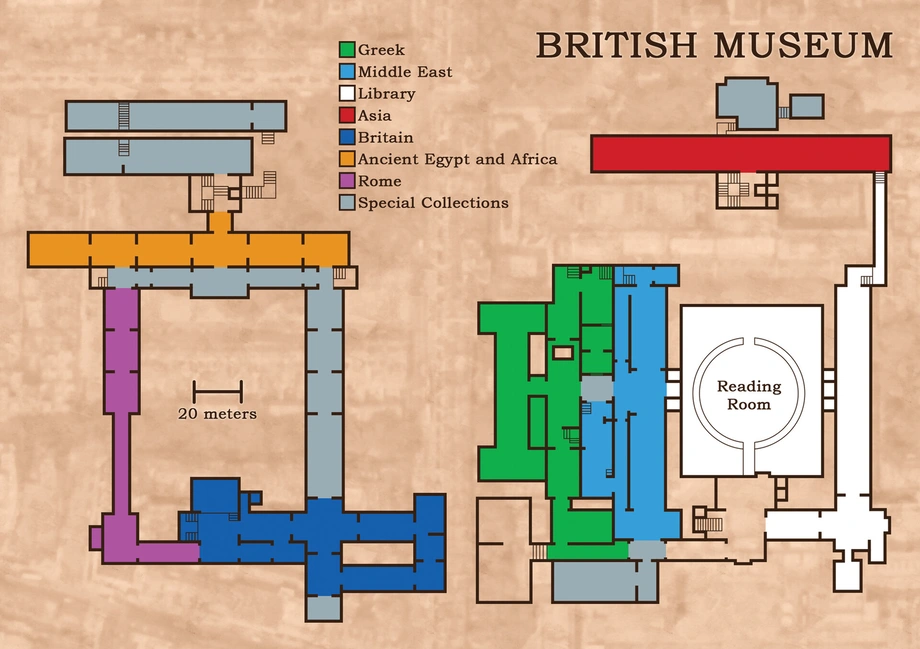
The return happens on screen. Decisions about moving actual objects remain with the institutions, governments and other parties responsible for them. The map gives viewers a way to explore the collection through places of origin rather than through a walk around museum galleries.
The audience sees both homecoming and a debate
Millions of people watched the museum project on overseas social media. Artists, technology workers and official embassy accounts shared it, while viewers sent Ruixian messages describing their reactions.
Some commenters criticised Britain's colonial history and the presence of foreign cultural objects in the museum. Others supported keeping objects there, pointing to public access and arguing that some might have faced loss or destruction in their countries of origin.
The disagreement centres on concrete concerns: who can see cultural treasures, who looks after them and where they belong. Ruixian's visual approach puts the objects' places of origin at the centre of that discussion. Viewers can begin with a country they know, then open an individual object's history.
From graphic design to computational storytelling
Ruixian's career has moved between art, product development and computing. After his undergraduate studies, he declined an opportunity to pursue a master's degree at the Royal College of Art and returned to China to work in product research and development.
His ideas gradually outgrew the technical tools he could use. He wanted to translate cultural subjects into experiences that people could explore, rather than leave them as text or static images.
Several stages shaped that work:
- In 2008, he moved to Britain to study graphic design at Central Saint Martins.
- After graduation, he returned to China and worked in product research and development.
- In 2016, he applied for a research assistant position at MIT to develop his information visualisation skills.
- He later pursued a master's program in MIT's Department of Urban Studies and Planning, receiving full tuition support and a living allowance.
Information visualisation means arranging information so that its patterns become easier to see. A subway map helps passengers understand connections. A weather map makes changing conditions visible across a region. Ruixian applies that same principle to cultural material, using location, movement, colour and sound to organise stories.
At MIT, he explored how conversations with AI could generate interactive maps. His later independent work brought that technical interest together with questions that had followed him since his student days in London.
Why an opera map took three months
Ruixian's Chinese opera project shows how much work comes before an AI system writes code. He spent three months consulting more than 100 reference works, repeatedly returning to the 29 volumes of the Survey of Chinese Opera.
The map compares regional traditions through familiar characters and performances. The same black faced Judge Bao, for example, can become a way to hear differences among Peking opera, Qinqiang and Henan opera.
Ruixian had to choose which traditions and roles to include, how to connect them and how to balance geographical range with historical detail. Those decisions shaped what viewers would learn before any interface was built.
His description of finding a subject's coordinates therefore has two meanings. A performance needs a position on the map, but it also needs a place within a larger cultural story. Choosing that place requires reading, comparison and judgement.
Engineering and design pull him in different directions. Engineering encourages reusable tools that solve recurring problems. Artistic work asks what makes a particular subject distinctive and how an audience might experience it. His maps attempt to bring both approaches into the same small screen.
Poetry becomes a landscape of sound and movement
Chinese poetry gives Ruixian another way to connect words with places. One mapping project brings together 165 poems and 60 locations. Across his poetry work, he has explored nearly 200 poems spanning about 3,000 years.
Mountains appear through mist, waves move beneath lines about a fractured country, and bird calls accompany verses associated with the Yellow Crane Tower. He places poems vertically above the landscape, drawing on the traditional vertical arrangement of Chinese writing.
Selection matters as much as animation. For Chang'an, he chose Du Fu's Spring View. For Jinan, he selected Li Qingzhao's lyric to the tune Like a Dream. For Suzhou, he used Zhang Ji's Mooring by Maple Bridge at Night. Familiar lines give viewers a point of entry into the map.
AI supplied more information than he could use. Ruixian's task was to reduce it to a sequence that people could follow and feel. The same process applied to appearance: he asked AI to extract colours from the landscape painting A Thousand Li of Rivers and Mountains, then tried at least 11 colour schemes.
A waterfall required repeated instructions about mist, transparency, gradients, splashes and spreading ripples. Producing code quickly still left many decisions about how the finished scene should look.
Autumn, mythical creatures and everyday curiosity
A university student in Beijing, identified by the pseudonym Xiao Hu, discovered Ruixian through an autumn map in late October. Its roughly 90 seconds of animation showed vegetation changing from green to red as autumn moved from northern to southern China.
She watched it several times, then began exploring his other subjects. They included 276 illustrations of mythical creatures from the Classic of Mountains and Seas, different operatic performances of the Judge Bao story and works of Chinese calligraphy.
Ruixian's world mythology map uses a water droplet to connect flood stories, including Yu the Great's flood control, Noah's Ark and the Sumerian flood narrative. His crop map begins with similarly direct questions about everyday life: where food grows, how much is produced and where it goes.
Books and ordinary observations supply further ideas. Reading about an ornithologist searching for an elusive owl in the forests of Russia's Far East led him to wonder about bird species and differences in their calls. Flowers beside a road prompted thoughts about what might be blooming elsewhere in the world.
These projects share a practical structure. A familiar object or experience supplies the starting point. A map then reveals connections that are harder to hold together in a list: between regions, across centuries or among different cultural traditions.
The work that remains with the creator
Ruixian's videos can take weeks to produce, sometimes three or four months, from choosing a topic to completing the final work. He usually handles the process alone.
His experience in a large technology company helped clarify what he wanted to change. As work became more repetitive, he felt he was putting different data into familiar templates and had less room for invention. Independent creation offered a way to return to his interests.
AI reduces some of the distance between an idea and a working program. Ruixian still has to research the subject, organise the material, select examples and revise the presentation. In his projects, those choices determine whether viewers encounter a collection of moving symbols or a story they want to follow.
He now makes room for reading, family and marathon running rather than placing work at the centre of everything. He credits that space with helping curiosity return. The questions behind his maps remain simple enough for anyone to ask: where did this come from, how did it get here and what connects it to somewhere else?
Key Points
- Ruixian's British Museum application maps nearly 5,000 artefacts from 99 countries and animates their imagined return home.
- The application also shows when objects entered the museum and lets users explore individual histories.
- His wider projects cover Chinese poetry, regional opera, mythology, crops and autumn colours.
- The opera map required three months of research using more than 100 reference works.
- AI helps generate code and visual elements, while Ruixian selects the material and directs the finished experience.