
Investment Slump Deepens Through October
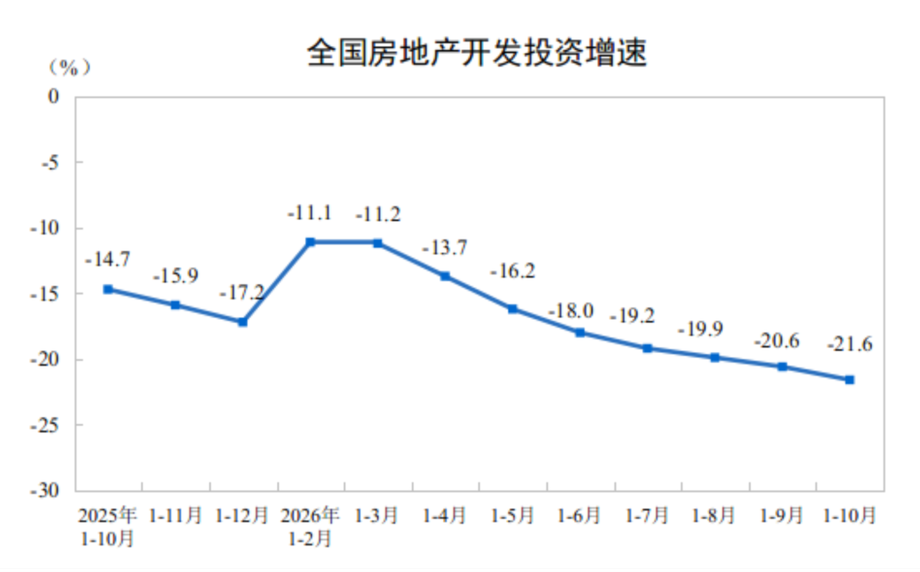
China's property developers invested 5.7215 trillion yuan in the first 10 months of 2026, down 21.6% from the same period a year earlier, as falling sales and tighter funding continued to squeeze construction. Residential investment accounted for 4.4102 trillion yuan, a decline of 21.4%.
Contents
- Investment Slump Deepens Through October
- How Much Worse Did Investment Become?
- New Property Sales Lose More Ground
- Existing Homes Take a Larger Role
- Fewer Starts and Fewer Finished Buildings
- Developer Funding Falls Faster Than Sales
- Unsold Stock Shrinks, but Older Space Accumulates
- The Regional Starting Point Was Uneven
- A Broader Slowdown Frames the Next Policy Debate
- Key Points
The figures released on November 16 show a widening gap between the market for newly built properties and transactions involving existing homes. New property sales covered 613.58 million square metres, down 13.7%, while registered transactions for existing homes reached 679.71 million square metres, up 11.4%, according to Ministry of Housing and Urban-Rural Development data.
Developers also completed less building work and received less money. Funding available for property development fell 21.9% to 6.153 trillion yuan. Completed floor area dropped 26.6%, a sharper decline than either sales or investment.
China's new property market therefore faced pressure at several points at once: less money entering development, fewer projects starting and less completed space becoming ready for use. Existing homes were changing hands more actively, giving the housing market a source of activity even as the business of developing new properties contracted.
How Much Worse Did Investment Become?
The National Bureau of Statistics recorded property investment of 5.3364 trillion yuan through September in its January to September release, published on October 19. Investment was then down 20.6% from a year earlier. Adding October widened the cumulative decline by 1 percentage point to 21.6%.
Residential investment followed the same direction. Its decline deepened from 20.5% through September to 21.4% through October. Housing represented about 77.1% of total property development investment in the latest figures, calculated from 4.4102 trillion yuan out of 5.7215 trillion yuan.
Subtracting the published cumulative totals gives an increase of 385.1 billion yuan in recorded investment between the September and October releases. Residential investment accounted for 297.7 billion yuan of that increase. These calculations show how much was added to the published totals; the annual comparisons use the statistics agency's comparable historical figures.
Property development investment covers more than the construction of homes. It includes building work, land development, land purchases and related facilities. A decline of this size reaches across several parts of the development process.
New Property Sales Lose More Ground
New property sales generated 5.855 trillion yuan in contract value during January through October, down 14.3% from a year earlier. The 13.7% decline in floor area sold was slightly smaller, meaning sales revenue contracted a little faster than the amount of space purchased.
Through September, sales area had fallen 13.2% and sales value 13.9%. October therefore brought a further deterioration in both cumulative measures. For residential properties specifically, sales area fell 14.2% through October and sales value fell 14.1%.
The published totals imply that October added 48.75 million square metres of new property sales and 475.1 billion yuan in contract value. Sales area measures the floor space written into formal purchase contracts, while sales value measures the total price agreed in those contracts.
Dividing the 10 months of sales value by sales area gives an average contract value of about 9,542 yuan per square metre across new commercial properties. The category includes homes, offices and commercial premises. The average changes with the types and locations of buildings sold, as well as their prices.
Existing Homes Take a Larger Role
Existing home transactions moved in the opposite direction. Their registered contract area rose 11.4% through October, compared with growth of 10.7% through September. The cumulative total increased from 617.46 million to 679.71 million square metres.
October consequently added 62.25 million square metres to registered existing home transactions, calculated from the two published totals. That exceeded the 48.75 million square metres added to new property sales during the same period.
Across the first 10 months, existing home transactions covered 66.13 million square metres more than new property sales, a difference equivalent to about 10.8% of the new property total. The two series cover different categories: the ministry's figures measure registered urban existing home contracts, while the new property series includes residential and other commercial buildings.
For developers, the destination of buyers' money matters. Payments for an existing home generally go to its current owner. Purchases of newly built homes can provide deposits, advance payments and mortgage proceeds to development companies. Growing resale activity can therefore coexist with shrinking receipts for developers, as happened in these figures.
Fewer Starts and Fewer Finished Buildings
Developers began construction on 370.36 million square metres during the first 10 months, down 24.4% from a year earlier. Residential starts fell 24.9% to 269.59 million square metres. A project enters this measure when foundation work begins, and its entire building area is counted.
The decline in new starts eased slightly from 24.9% through September. Completions moved the other way: finished floor area fell 26.6% through October, compared with a 25.1% decline through September. Residential completions dropped 27.9%, reaching 179.14 million square metres.
Total completed floor area reached 255.44 million square metres. Buildings enter this category after construction is finished and they meet the requirements for acceptance and use. The measure tracks an important practical stage, when buildings become ready to be handed over.
The construction series covered 5.68164 billion square metres, down 13.0%, including 3.94637 billion square metres of residential space, down 13.3%. This broad measure includes projects carried over from earlier years, work restarted during the period and buildings completed during it. Its much larger size reflects the many projects passing through different stages of development.
Developer Funding Falls Faster Than Sales
Developers received 6.153 trillion yuan in funding during January through October, down 21.9% from a year earlier. That decline was 7.6 percentage points deeper than the 14.3% fall in new property sales value, showing that the contraction extended beyond purchases alone.
Domestic loans recorded the sharpest fall among the main funding categories listed, dropping 33.4% to 814.8 billion yuan. Through September, domestic lending had been down 33.1%. Funding raised by developers themselves fell 21.9% to 2.2169 trillion yuan.
Money tied to buyers also declined. Deposits and advance payments dropped 15.5% to 1.962 trillion yuan, while personal mortgage loan proceeds received by developers fell 22.1% to 841.4 billion yuan.
Together, deposits, advance payments and mortgage proceeds amounted to 2.8034 trillion yuan, or about 45.6% of total developer funding. This large share helps explain the connection between sales and construction finance: fewer purchases reduce an important stream of money available for development.
The figures measure money actually available for property development during the reporting period. They group several funding channels together, so the total captures both weaker borrowing and lower receipts associated with customers.
Unsold Stock Shrinks, but Older Space Accumulates
Completed new property available for sale or rent stood at 744.12 million square metres at the end of October, down 1.7% from a year earlier. It was also 4.13 million square metres below the 748.25 million recorded at the end of September.
Properties that had been awaiting sale for less than three years accounted for 536.52 million square metres, down 5.3% from a year earlier. Subtracting that category from the total leaves 207.60 million square metres that had been awaiting sale for at least three years, about 27.9% of all unsold completed space.
The same calculation for September gives 206.28 million square metres in the older category. Older unsold space therefore increased by 1.32 million square metres between the two releases, even as total stock declined. Properties can move into that older category as time passes.
Inventory also depends on the flow of newly completed buildings. With completions falling 26.6%, less finished space was entering the market. At the same time, sales and rentals remove space from the available stock. Both flows help explain how unsold inventory can fall during a period of weaker sales.
The Regional Starting Point Was Uneven
The September statistics provide a regional picture immediately before the latest national update. Property investment fell in all four broad regions, with the steepest decline in the northeast, where investment dropped 29.2% to 105.8 billion yuan.
Investment fell 21.1% in the east, 21.9% in central China and 16.7% in the west. The eastern region accounted for 3.1392 trillion yuan, about 58.8% of the national total of 5.3364 trillion yuan. Its size gave developments there a large influence on the national result.
Sales also showed the greatest weakness in the northeast. New property sales area there fell 21.9% through September, compared with declines of 12.9% in the east, 13.3% in central China and 12.3% in the west. Northeastern sales value fell 23.7%.
These regional figures cover January through September; an October regional breakdown was not given. They show that the national downturn entered October with different levels of intensity across the country.
A Broader Slowdown Frames the Next Policy Debate
China's property contraction coincided with weaker activity elsewhere in October. Fixed asset investment fell 8.1% during the first 10 months, compared with a 7.2% decline through September. Retail sales rose just 0.4% in October, slowing from 1.1% in September, while industrial output increased 4.8%.
The surveyed urban unemployment rate offered a brighter reading, falling to 5.1% from 5.2% in September. Residential prices nevertheless continued to decline in October, adding another source of pressure to the housing market.
Beijing had introduced support in late September, including mortgage subsidies, a larger public borrowing quota and measures aimed at supporting investment. Policymakers now face weaker property development alongside slow consumer spending, increasing the importance of domestic demand as a source of growth.
The main dates frame how the picture developed and when economic priorities are usually reviewed:
- Late September 2026: Authorities stepped up economic support, including mortgage subsidies and additional public borrowing capacity.
- October 19, 2026: The statistics agency published figures showing property investment down 20.6% through September.
- November 16, 2026: The October update showed the cumulative property investment decline widening to 21.6%.
- December 2026: The Central Economic Work Conference, usually held in the first half of the month, is expected to outline priorities for 2027. No exact meeting date was given.
The property statistics come from a comprehensive survey of legally registered development businesses with active operations, conducted monthly except in January. Annual growth rates use comparable figures after revisions to the previous year's data under statistical and inspection rules. This method keeps the comparisons aligned when the historical records change.
Key Points
- Property development investment fell 21.6% to 5.7215 trillion yuan in January through October 2026.
- New property sales area declined 13.7%, while sales value fell 14.3%.
- Registered existing home transaction area rose 11.4% to 679.71 million square metres.
- Developer funding dropped 21.9%, with domestic loans down 33.4%.
- Construction starts fell 24.4% and completed floor area declined 26.6%.
- Total unsold completed space decreased, while the amount awaiting sale for at least three years increased between September and October.
- The December economic policy conference is expected to set priorities for 2027 amid weaker investment and consumer spending.