

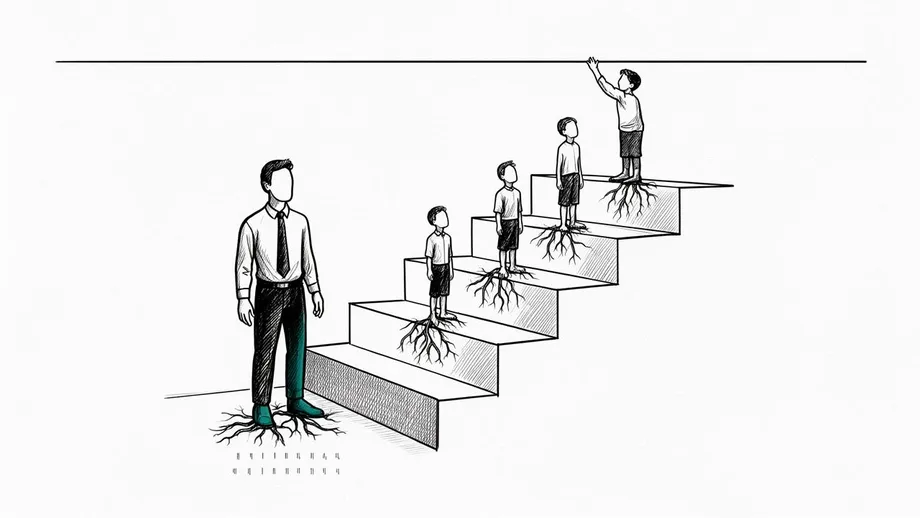
Only a Third Changed Income Groups in 2024
South Korea's income ladder became harder to climb in 2024, with just 16.9% of people moving into a higher income group, the first reading below 17%. Among people already in the richest fifth, 86.5% stayed there, while 70.7% of those in the poorest fifth remained at the bottom.
Contents
- Only a Third Changed Income Groups in 2024
- What Moving Between Income Groups Means
- The Bottom Became Harder to Leave
- Eight Years Reveal Lasting Positions
- Young Adults Still Move More, but Climb Less Often
- An Older Population Changes the National Rate
- More People Lost Income, and Large Gains Became Rarer
- What the Figures Mean for Work and Spending
- Key Points
The National Data Office's 2024 Income Mobility Statistics, released on October 29, put total movement between income groups at 33.0% for the period from 2023 to 2024. That means roughly one person in three changed groups, while two in three stayed in the same position.
The headline figures show a decline of 1.1 percentage points from the previous year; another published tabulation gives the decline as 1.2 points. The central result is the same: mobility reached its lowest level in the series, which tracks incomes from 2017 and began publication in 2018.
Upward movement accounted for 16.9% of people, while downward movement accounted for 16.1%. Both became less common. The result was a more settled income ranking, alongside a separate deterioration in how many people saw their earnings increase.
What Moving Between Income Groups Means
The statistics divide people into five income groups, called quintiles. Each contains 20% of the population covered by the comparison, ranked from the lowest income to the highest. Moving up means crossing into a higher group; moving down means entering a lower one.
A person's income can rise without their group changing. Someone whose earnings increase slightly may remain among the lowest fifth if the increase is too small to cross the next threshold. Their position also depends on how other people's earnings change.
The study covers South Korean residents aged 15 and older who had wage or business income in both years being compared. It excludes property income and public and private transfers, such as benefits or money received from other people. Its focus is therefore income from work and business, rather than all the resources a person can use.
The Bottom Became Harder to Leave
Among people in the lowest income quintile in 2023, 29.3% moved out of it in 2024. That was down from 29.9% in the preceding annual comparison. Put simply, fewer than three out of every 10 people at the bottom moved to a higher group.
The matching retention rate rose to 70.7%, an increase of 0.6 percentage points. For people at this end of the distribution, the annual figures show that remaining in the bottom group was much more common than leaving it.
At the other extreme, 86.5% of people in the highest quintile stayed there, also an increase of 0.6 percentage points. The gap between retention at the top and bottom was 15.8 percentage points, calculated from 86.5% and 70.7%. The highest income group was therefore the more persistent of the two.
The published rate of entry into the top quintile fell to 3.4%, down 0.1 percentage points. Choi Baul, head of the policy statistics research division at the National Data Research Institute, described the changes in the bottom and top groups together:
Fewer people escaped the first quintile, while entering the fifth quintile can also be seen as having become harder than the previous year.
Eight Years Reveal Lasting Positions
The longer comparison follows people from 2017 through 2024. Among those who began in the bottom quintile in 2017, 24.9% remained there throughout all eight years. That is approximately one in four of the original group.
Among people who started in the top quintile, 56.0% stayed there throughout the same period. Continuous retention at the top was more than twice the rate at the bottom, with a difference of 31.1 percentage points.
These figures track whether people stayed in the same group every year. Someone who left the bottom group temporarily and later returned would have a different history from someone who remained there throughout. Following the full sequence gives a clearer picture of how long an income position can last.
The series also provides a timeline of the weakening movement between groups:
- 2017: The starting income year for the comparison that follows people through 2024.
- 2018: Publication began, with an initial mobility reading of 35.8%.
- Since 2020: Income mobility has declined each year.
- 2023 to 2024: Mobility fell to 33.0%, with upward movement at 16.9% and downward movement at 16.1%.
- October 29: The National Data Office released the 2024 results.
Young Adults Still Move More, but Climb Less Often
People aged 15 to 39 remained the most mobile age group. Their total mobility rate was 39.3%, compared with 30.4% among people aged 40 to 64 and 24.4% among those aged 65 and older.
Young people's mobility exceeded that of the oldest group by 14.9 percentage points. Early working life often includes entering employment, changing jobs and building earnings, so people at this stage have more opportunities to change income groups.
Even within this more mobile group, upward movement weakened. The share of people aged 15 to 39 who moved into a higher quintile was 22.4%, the lowest since publication began in 2018. Their total mobility also fell from the previous year.
The direction of movement differed across ages. Upward moves outnumbered downward moves among people aged 15 to 39. Among those aged 40 to 64, and those aged 65 and older, downward movement was more common.
Young adults therefore retained a better chance of climbing than the population average, but that chance had narrowed. Their record low upward mobility also shows why the national trend needs to be examined within age groups, as well as across the population.
An Older Population Changes the National Rate
The age composition of the people covered by the statistics shifted. The share aged 15 to 39 fell by 0.9 percentage points, while the share aged 65 and older increased by 0.9 points.
Choi Baul, the National Data Research Institute official, identified the growing presence of older people as one reason for the decline in the national mobility rate:
As more older people with low income mobility entered the population being analysed because of ageing, income mobility decreased overall.
The arithmetic is straightforward. When a group with a mobility rate of 24.4% accounts for a larger share of the total, and a group with a rate of 39.3% accounts for a smaller share, the combined rate faces downward pressure.
The release does not quantify how much of the total decline came from this change in age composition. Youth mobility also fell, meaning the results reflect changes within an age group as well as changes in the balance between groups.
More People Lost Income, and Large Gains Became Rarer
Actual income changes provide another view of the slowdown. In 2024, 61.4% of people had higher wage or business income than a year earlier, down 2.6 percentage points. Meanwhile, 36.0% had lower income, up 2.1 points.
Those changes put the previous year's corresponding shares at 64.0% for income increases and 33.9% for decreases. The gap between the share gaining income and the share losing it narrowed from 30.1 percentage points to 25.4 points.
Small increases became more common. The share whose income rose by less than 10% reached 24.6%, up 2.3 percentage points. People in this category accounted for about two fifths of everyone whose income increased, calculated by dividing 24.6% by 61.4%.
Larger increases became less common. The share with gains of at least 10% but less than 50% fell by 3.1 percentage points, while the share with gains of 50% or more fell by 1.8 points. Every reported category of income decline grew.
Falling downward mobility and rising income losses can occur together because they measure different things. A person's earnings may fall while remaining within the same quintile. The 2024 results show both a more stable ranking between groups and a larger share of people receiving less income.
What the Figures Mean for Work and Spending
For workers and business earners near the bottom, the most immediate finding is the reduced chance of entering a higher income group. The fall in the exit rate from 29.9% to 29.3% is modest over one year, but it sits alongside eight years of continuous bottom quintile membership for nearly a quarter of those who started there in 2017.
For young adults, the 22.4% upward mobility rate makes access to better earnings a central concern. Job entry, job changes and business income are routes through which their position can improve. The statistics show the outcome of those income changes, while leaving the contribution of each route unmeasured.
For spending, the change in earnings matters directly. More people experiencing income losses, alongside fewer receiving large increases, can limit the room available for additional purchases. The extent of that pressure depends on other household resources, including income outside the study's scope.
South Korea's results bring together three developments: a population shifting toward ages with less income movement, weaker upward mobility among young adults, and persistent positions at both ends of the earnings distribution. Each affects how widely opportunities to earn more are shared.
Key Points
- Income mobility fell to a record low of 33.0% between 2023 and 2024.
- Upward movement reached 16.9%, its first reading below 17%; downward movement was 16.1%.
- Among people in the bottom quintile, 70.7% stayed there for another year. At the top, 86.5% remained.
- From 2017 through 2024, 24.9% of the original bottom group and 56.0% of the original top group stayed in those positions throughout.
- Upward mobility among people aged 15 to 39 fell to 22.4%, the lowest since publication began.
- The share receiving higher wage or business income fell to 61.4%, while 36.0% experienced a decrease.