

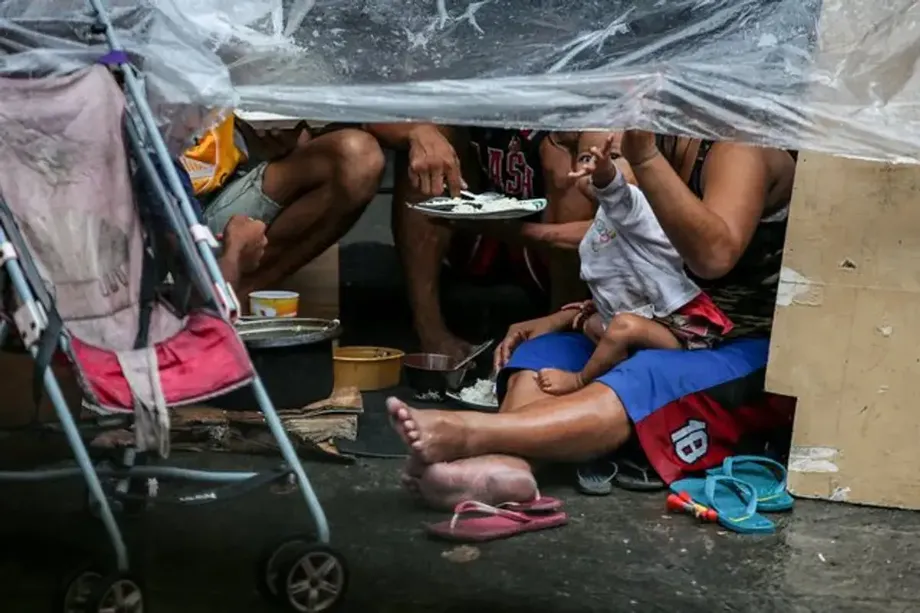
More families go hungry, and more go hungry repeatedly
More than one in five Filipino families experienced hunger with nothing to eat in the three months preceding September 2026, according to Social Weather Stations (SWS). Its survey conducted from September 21 to 27 put involuntary hunger at 22.6%, up from 20.3% in June, with much of the increase coming from families going hungry often or always.
Contents
- More families go hungry, and more go hungry repeatedly
- Severe hunger accounts for most of the increase
- Metro Manila and Luzon drive the national rise
- Poverty rises as the borderline group shrinks
- Food poverty reaches 44% of families
- Families report a larger monthly income gap
- Most poor families describe long periods of hardship
- A rebound after June's improvement
- The September 2025 survey covers a different period
- How much precision do the surveys provide?
- Key Points
Metro Manila recorded the highest hunger rate at 27%, while Luzon outside the capital registered the biggest increase, rising 6.3 percentage points to 23.6%. The national deterioration came alongside a rise in self-rated poverty to 55%, representing an estimated 16.8 million families.
September's hunger reading was 1.5 percentage points above the 21.1% annual average recorded in 2020 during COVID-19 restrictions. The comparison places a single survey reading alongside a full year's average. The September figure also exceeded the 20.2% annual average for 2025.
The most striking change was in severe hunger. Families reporting hunger often or always increased from 4.5% in June to 6.4% in September. Moderate hunger, experienced once or a few times, rose much less, from 15.8% to 16.2%.
SWS, an independent polling organisation, interviewed 1,500 adults nationwide about their families' experiences. Its results describe hunger during the preceding three months, rather than simply whether respondents had food on the interview day. Alongside the hunger figures, the poverty survey shows more families placing themselves below the line separating poor from not poor, and reporting larger gaps between their income and the budget they need.
Severe hunger accounts for most of the increase
Severe hunger rose by 1.9 percentage points between June and September, compared with a 0.4 percentage point increase in moderate hunger. Together, those changes make up the 2.3 percentage point rise in total hunger.
About 83% of the national increase therefore came from the severe category, calculated by dividing the 1.9 point increase by the total rise of 2.3 points. This is the clearest indication of how families' experiences worsened: repeated hunger increased much faster than occasional hunger.
September's severe hunger rate of 6.4% is roughly equivalent to six families in every 100 reporting that they often or always went hungry with nothing to eat. Moderate hunger affected about 16 in every 100 families.
SWS uses involuntary hunger to describe being hungry and having nothing to eat. Its frequency categories help distinguish an occasional episode from repeated deprivation. A family can fall into either category regardless of whether it describes itself as poor, although hunger is more common among families that do.
Metro Manila and Luzon drive the national rise
Metro Manila's hunger rate increased from 21% in June to 27% in September, a rise of six percentage points. In Balance Luzon, the survey's term for Luzon outside Metro Manila, the rate climbed from 17.3% to 23.6%.
The Visayas moved in the opposite direction. Hunger fell from 22.3% to 16%, a decline of 6.3 percentage points, making it the area with the lowest September rate. Mindanao changed little, moving from 24% to 23.7%.
September's regional results were:
- Metro Manila: 27%, up from 21% in June.
- Mindanao: 23.7%, down from 24%.
- Balance Luzon: 23.6%, up from 17.3%.
- Visayas: 16%, down from 22.3%.
Metro Manila's rate was 11 percentage points higher than the Visayas figure. SWS attributed the national increase primarily to the rises in the capital and the rest of Luzon. Families in different parts of the country therefore experienced sharply different changes during the same period.
Poverty rises as the borderline group shrinks
Fifty-five percent of families considered themselves poor in September, up from 49% in June. SWS estimated their number at 16.8 million, compared with 13.6 million three months earlier, an increase of 3.2 million in the published household estimates.
The share describing themselves as borderline fell from 14% to 9%. Families describing themselves as not poor changed much less, from 37% to 36%. SWS said the poverty increase came mainly from the shrinking borderline group.
SWS, the organisation conducting the survey, explained how respondents placed themselves:
The rise came mainly at the expense of the Borderline (those who placed themselves on the line dividing the Poor and the Not Poor), which fell by five points from 14 percent to 9 percent, while the Self-Rated Not Poor, or those rating themselves as Hindi Mahirap or Not Poor, hardly moved from 37 percent to 36 percent.
Balance Luzon recorded the largest increase in self-rated poverty, from 41% to 51%. Metro Manila rose four points to 44%, the Visayas rose four points to 63%, and Mindanao rose three points to 64%.
Mindanao and the Visayas had the highest poverty rates, while Metro Manila had the highest hunger rate. The survey asks different questions about these experiences: poverty concerns a family's assessment of its circumstances, while hunger concerns actual episodes of having nothing to eat.
Food poverty reaches 44% of families
Families assess food poverty by considering the type of food they eat. In September, 44% described themselves as food-poor, up from 36% in June. The food-borderline share fell from 15% to 9%, while the share describing themselves as not food-poor declined from 49% to 47%.
The principal published SWS estimate puts September's food-poor population at 13.3 million families, up from 10.2 million in June. A figure of 12.2 million was also published for the same September rate of 44%; no explanation was given for the difference.
Food poverty was highest in Mindanao at 52%, followed by the Visayas at 51%, Balance Luzon at 40%, and Metro Manila at 31%. Nationally, September's 44% was three points above the 41% annual average for 2025 and the highest reading since 51% in December 2024.
Hunger also became more common within poorer groups. Among families describing themselves as poor, it rose from 24.5% to 27.9%. Among food-poor families, it increased from 29.9% to 33.2%, meaning roughly one in three experienced involuntary hunger.
SWS attributed the national increase to both a larger share of families rating themselves poor and higher hunger within those groups. More families were in the categories most exposed to hunger, and hunger became more frequent within those categories.
Families report a larger monthly income gap
Poor families put the median monthly budget needed to stop considering themselves poor at P15,000 in September, up from P14,000 in June. The median reported shortfall between their income and that budget increased from P5,000 to P6,000.
The median is the middle response when answers are arranged from lowest to highest. It gives a measure of the typical answer without allowing a few very large or very small amounts to dominate the result.
The reported poverty threshold rose by P1,000, or about 7.1%, while the income gap rose by P1,000, or 20%. Families were describing both a higher required budget and a larger amount missing from their monthly income.
For food alone, the median threshold was P8,000 a month, with a P3,000 gap. These amounts reflect families' own assessments of what they need. The survey results do not provide a breakdown showing how much of the change came from food prices, other expenses or changes in earnings.
Most poor families describe long periods of hardship
SWS classified 38.7% of all families as always poor, meaning they had never experienced being non-poor. Another 9% were usually poor, having last experienced being non-poor five or more years earlier. A further 7.2% were newly poor, having experienced being non-poor within the previous one to four years.
The corresponding estimates were 11.7 million always poor families, 2.7 million usually poor families and 2.2 million newly poor families. These published categories total 16.6 million, close to the separately reported 16.8 million estimate for all self-rated poor families.
The always poor group accounted for about seven in every 10 self-rated poor families, using 38.7% divided by the 55% poverty rate. Persistent hardship therefore made up the largest part of the September poverty picture.
SWS also examined families currently describing themselves as borderline or not poor. Of all families, 12.5% had been poor within the previous one to four years, 16.5% had been poor five or more years earlier, and 15.2% had never experienced being poor. The categories show that families' current answers sit within different histories of hardship.
A rebound after June's improvement
September's increase followed a decline in hunger earlier in 2026. The national rate fell from 23.2% in March to 20.3% in June, before rising to 22.6% in September. September was therefore 0.6 percentage points below March, even though it was above the pandemic year's annual average.
The main survey dates and results trace that movement:
- March 2026: total hunger stood at 23.2%, with moderate hunger at 17.7% and severe hunger at 5.1%.
- June 20 to 29, 2026: total hunger fell to 20.3%, moderate hunger to 15.8% and severe hunger to 4.5%.
- September 21 to 27, 2026: total hunger rose to 22.6%, moderate hunger to 16.2% and severe hunger to 6.4%.
- October 13, 2026: SWS released the third quarter self-rated poverty results, showing 55% of families considered themselves poor.
Severe hunger in September was 1.3 percentage points above March, even as total hunger remained slightly lower. The frequency of hunger had worsened beyond its earlier level for the families in the severe category.
The September 2025 survey covers a different period
SWS also conducted a survey from September 24 to 30, 2025. That survey put hunger at 22%, compared with 16.1% in June 2025, an increase of 5.9 percentage points. Its fieldwork dates and June baseline belong to the previous year.
Metro Manila had the highest rate in September 2025 at 25.7%, followed by Balance Luzon at 23.8%, Mindanao at 19.7% and the Visayas at 18.7%. Half of families described themselves as poor, and 41% described themselves as food-poor.
The 2025 results also showed hunger spreading among families that did not consider themselves poor. Hunger in that group increased from 11.4% in June to 17% in September, while hunger among self-rated poor families rose from 21% to 26.9%.
SWS explained the relationship between poverty and hunger in its survey statement:
Hunger occurs at different rates among the poor and the non-poor. At any single point in time, hunger is usually higher among the poor.
By September 2026, self-rated poverty was five percentage points above the September 2025 figure, and food poverty was three points higher. The 2025 annual hunger average of 20.2% matched the average for 2024.
How much precision do the surveys provide?
The September 2026 survey used interviews conducted in person with 1,500 adults aged 18 and above. It included 600 respondents in Balance Luzon and 300 each in Metro Manila, the Visayas and Mindanao. The survey was non-commissioned.
SWS reported a sampling margin of error of plus or minus three percentage points for national estimates. Regional margins were plus or minus four points for Balance Luzon and plus or minus six points each for Metro Manila, the Visayas and Mindanao.
A margin of error describes uncertainty that arises from interviewing a sample rather than every family. The 22.6% national estimate has a stated sampling range extending three percentage points in either direction. Smaller regional samples have wider margins.
The 2.3 percentage point change since June is smaller than the stated margin for an individual national survey. Assessing the statistical certainty of a change between two surveys requires considering uncertainty in both. The reported figures nevertheless give a consistent account of the measured September movement: severe hunger rose, the poor and food-poor shares increased, and hunger became more common within those groups.
SWS did not give a date for the next hunger survey release. The September results leave the immediate focus on whether the increase in repeated hunger persists and whether families reporting larger income gaps regain enough resources to meet their food needs.
Key Points
- Involuntary hunger reached 22.6% in September 2026, up from 20.3% in June.
- Severe hunger rose from 4.5% to 6.4%, accounting for most of the national increase.
- Metro Manila had the highest hunger rate at 27%; Balance Luzon recorded the largest increase.
- Self-rated poverty rose to 55%, representing an estimated 16.8 million families.
- Food poverty reached 44%, and hunger affected 33.2% of food-poor families.
- The median monthly budget families said they needed to escape poverty rose to P15,000, with a P6,000 income gap.
- September's hunger reading exceeded the 21.1% annual average for 2020 but remained below the 23.2% reading in March 2026.