
Most of the supply buffer is still outside Thailand
Thailand's Department of Energy Business puts the country's oil supply at at least 118 days of demand, but only 51 days are physically held inside the country. Another 33 days are in transit, while 34 days represent confirmed purchases awaiting shipment. That distinction matters as attacks on tankers disrupt the Strait of Hormuz, a route serving Thailand's main crude supply region.
Contents
- Most of the supply buffer is still outside Thailand
- What the 118 days actually include
- Hormuz is disrupted, but oil is still moving
- Lower refinery output is drawing down stocks
- Tank inventories and customer demand tell different stories
- Distribution and exports remain part of the equation
- March showed the limits of a national reserve headline
- The key dates connect supply, prices and oversight
- Shipping risk can raise costs even when cargoes arrive
- Key Points
The assessment uses domestic stock figures dated October 8, 2026, alongside refinery and fuel sales data for October 6. Oil held in Thailand totals 6,150 million liters, including crude and finished fuels. Crude in transit amounts to 4,161 million liters, and confirmed crude awaiting transport totals 4,258 million liters. Together, these categories amount to 14,569 million liters, but they are at different stages of the journey to consumers.
The figures also show stocks being used to cover a gap between daily production and sales. On October 6, finished diesel production was 55.479 million liters against sales of 57.069 million liters. Gasoline production was 28.002 million liters against sales of 29.784 million liters. Those differences were 1.590 million liters and 1.782 million liters respectively.
Thailand therefore faces two connected pressures: getting contracted crude safely into the country and keeping sufficient fuel moving from refineries and depots to customers. Its March experience shows why a large national reserve figure does not necessarily prevent empty pumps. At that time, Thailand reportedly had 107 days of oil reserves, yet a survey found most stations checked were closed, running out of some grades or close to doing so.
What the 118 days actually include
The 51 days of domestic supply comprise 26 days of commercial stocks and 25 days of legally required reserves designated for emergency use. The emergency component is therefore almost half of the oil cover already inside Thailand. It should not be treated as interchangeable with stock available for ordinary commercial sales.
The two categories outside the country account for 67 of the stated 118 days, or about 57% of the total duration. Their combined volume is 8,419 million liters. They provide a substantial supply pipeline, but its usefulness depends on loading, passage, arrival and processing proceeding as expected.
Compared with the 107 days reported during March's shortages, the October headline is 11 days higher, an increase of about 10.3%. That is a comparison between published totals, not proof that immediately accessible stocks rose by the same amount. The March figure does not come with the same breakdown between domestic inventory, cargoes in transit and purchases awaiting shipment.
Nor should the 118 days be read as a countdown calculated from one day's refinery throughput. The domestic inventory includes crude and finished products, while the cargoes outside Thailand are crude. They occupy different places in the supply chain, and the published information does not fully explain the demand assumptions used to convert each category into days.
Hormuz is disrupted, but oil is still moving
Thailand's January 2026 supply breakdown assigns 53% to the Middle East, 27% to other sources including the United States, West Africa and Australia, 11% to the Far East and 9% to domestic crude. These are January shares, not a measurement of the origin of every cargo expected in October.
The import route information marks the Hormuz passage as disrupted. Routes through the Bab el Mandeb Strait, and those from the Americas, West Africa, East Asia and Oceania, remain available. Those alternatives leave Thailand with options, although an available route does not itself establish how much replacement crude has been purchased or when it will arrive.
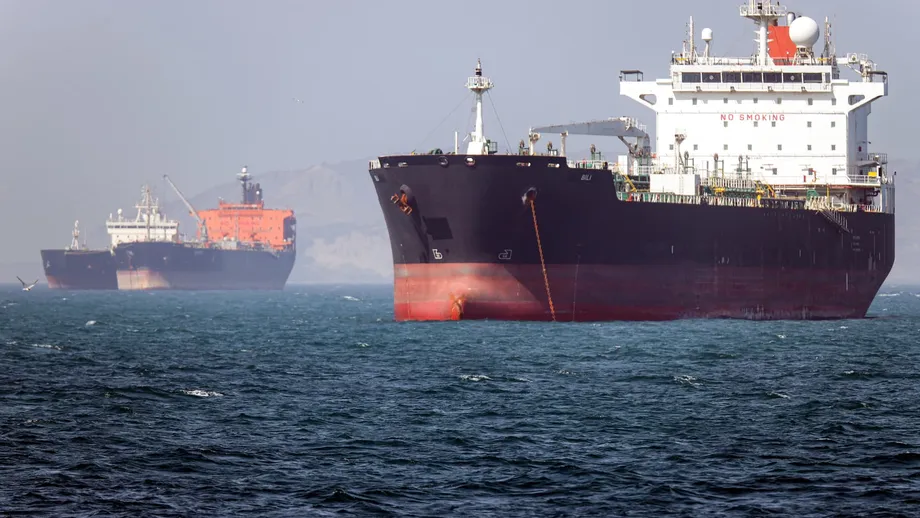
Disruption also does not mean that all Hormuz traffic has stopped. Kpler's tracking put crude shipments through the strait at about 10.3 million barrels per day for the week ending before October 6, compared with a baseline before the war of 13.5 million barrels. That is about 23% lower. Windward estimated current flows at 9 million to 10 million barrels per day against its own earlier baseline of 14.5 million barrels.
The estimates differ in both current volume and baseline, so they should not be combined into a single precise measure. Both show oil continuing to move below earlier levels. Tankers have been using a route along Oman's coast protected by a substantial United States military commitment. Some carry crude through Hormuz and transfer it to other vessels in the Gulf of Oman for delivery to Asia, reducing exposure for the onward voyage while requiring more ships and handling.
Lower refinery output is drawing down stocks
Thailand's refineries processed 168.235 million liters of crude on October 6. They produced 61.097 million liters of base diesel and 30.961 million liters of base gasoline. Base fuels are the petroleum components used before blending with ingredients such as biodiesel or ethanol.
Base diesel output was below the January daily average of 77.285 million liters and the March average of 79.433 million liters. The October reading was about 21% below January. Base gasoline production fell less sharply, coming in about 7% below January's 33.265 million liters and below March's 32.034 million liters.
Finished fuel production across refinery and regional depots showed a similar pattern. Diesel output of 55.479 million liters was about 16% below January's 66.365 million liters and about 28% below March's 77.478 million liters. Gasoline output of 28.002 million liters was about 14% below January's 32.396 million liters and below March's 32.019 million liters.
The figures record 4.511 million liters of biodiesel blended into diesel and 3.195 million liters of ethanol blended into gasoline. Base fuel output and finished fuel output measure different stages of processing and distribution. They should not be added together as separate quantities of fuel available for sale.
Diesel and gasoline sales together exceeded finished production by 3.372 million liters that day. This indicates inventory being used to meet sales, but a single daily reading does not establish how long the gap will persist. The figures do not identify why production was lower or provide a schedule for its recovery.
Tank inventories and customer demand tell different stories
Stocks of base diesel in storage tanks totaled 1,297 million liters, compared with a January average of 1,229 million liters, an increase of about 5.5%. Base gasoline stocks were 637 million liters against 725 million liters in January, a decline of about 12.1%. The two products therefore entered the October assessment with different inventory positions.
Stocks of blended diesel were 38 million liters, compared with a January average of 40 million liters. Blended gasoline stocks were 74 million liters against 75 million liters. These tank figures are components of the supply chain, not extra volumes to add to the national reserve total.
Demand was also uneven. Total October 6 diesel sales of 57.069 million liters were below January's 66.916 million liters and March's 78.213 million liters. Gasoline sales of 29.784 million liters were below January's 32.666 million liters and March's 32.851 million liters. The stock draw therefore occurred even with sales below those earlier averages.
Within diesel demand, sales to transport customers rose to 1.835 million liters from a January average of 1.122 million liters, about 64% higher. Sales to the category covering electricity, agriculture and fishing reached 3.863 million liters against 2.990 million liters, about 29% higher.
Other channels contracted. Diesel sales to service stations were 43.743 million liters against a January average of 51.304 million liters. Industrial sales fell to 1.729 million liters from 4.004 million liters, a drop of about 57%. These customer figures are volumes in millions of liters, not retail prices. They show why falling national sales can coexist with stronger demand from particular sectors.
Distribution and exports remain part of the equation
Major traders registered under section 7 accounted for approximately 92% of the reported diesel and gasoline sales, with wholesalers known as jobbers accounting for about 8%. Section 7 traders sold 52.203 million liters of diesel and 27.635 million liters of gasoline. Jobbers sold 4.866 million liters of diesel and 2.149 million liters of gasoline.
The distribution network depends heavily on roads. Trucks carried 44.7% of diesel leaving refineries, pipelines carried 32.8%, and ships carried 22.5%. National stock levels alone cannot show whether deliveries are reaching every station or commercial customer quickly enough.
Thailand also continued exporting fuel to Laos and Myanmar. Base diesel exports totaled 4.876 million liters on October 6, compared with a January average of 6.021 million liters, about 19% lower. Exports of gasoline rated at 91 to 92 octane totaled 1.611 million liters against 1.160 million liters in January, about 39% higher.
Those shipments belong in the supply picture, but they cannot simply be added to the domestic finished fuel production deficit. Base diesel exports and domestic blended diesel sales are different categories. The figures do not establish that exports caused the domestic stock draw or that authorities have decided to restrict them.
March showed the limits of a national reserve headline
During the March shortages, preliminary Energy Ministry findings attributed part of the pressure to fuel demand rising by more than 20%. Major traders prioritized deliveries to branded stations. Jobbers received less fuel, while some transport, industrial and agricultural customers shifted toward stations offering cheaper diesel.
A survey conducted by 86 teams at 2,649 stations on March 15 to 17 found 241 closed because they lacked fuel, 1,912 with some grades exhausted or nearly exhausted, and 496 operating normally. The first two groups together represented 81.3% of the sample. Inspectors checking the closed stations found no fuel remaining in their storage tanks, rather than evidence of hidden stocks at those locations.
By March 22, the reported national count of stations experiencing shortages was 2,082. However, the accompanying brand figures add up to 2,251: PT had 667, PTT 563, Bangchak 484, Susco 140, Caltex 120 and Shell 108. That discrepancy prevents the brand breakdown from being treated as a reconciled national total.
Following a fuel price increase of 6 baht per liter on March 26, the reported shortage count fell to 389 stations on March 27. The accompanying brand list is again inconsistent, retaining a figure of 563 for PTT alone. The headline counts suggest a substantial improvement, but the detailed figures cannot verify its exact scale. The timing also does not prove that the price increase alone resolved the shortages.
The March episode prompted requirements for refineries and traders to submit daily fuel receipt and dispatch records, including transport documentation and destination customers. Traders were also instructed to provide records retrospectively from February 1. These measures addressed a practical weakness: authorities needed to track where fuel was going, rather than rely only on aggregate reserves.
The key dates connect supply, prices and oversight
The sequence separates March's station shortages and policy response from October's stock assessment and renewed shipping risk. Thailand's calendar year 2569 corresponds to 2026.
- March 15 to 17: A survey of 2,649 stations found 241 closed and 1,912 with some fuel grades exhausted or nearly exhausted.
- March 22: The reported number of stations facing shortages reached 2,082, although the brand breakdown did not match that total.
- March 25 to 27: Fuel subsidy rates were reduced, prices rose by 6 baht per liter on March 26, and the reported shortage count fell to 389 the following day.
- March 31: Prime Ministerial Order No. 5/2569 appointed Ekniti Nitithanprapas to chair a committee studying fuel pricing costs.
- October 6: Refinery and sales figures showed diesel and gasoline sales exceeding finished production.
- October 8: Stock figures used in the 118 day supply assessment were recorded.
Price protection had also carried a large fiscal cost. By late March, the Oil Fuel Fund reportedly had a deficit of 38.464 billion baht, with daily outflows of 1.368 billion baht. Those are March figures, not an October fund balance.
Shipping risk can raise costs even when cargoes arrive
The Joint Maritime Information Center counted nearly 20 commercial vessels, mostly tankers, attacked over the month preceding the October 6 shipping assessment. Windward estimated that Iran attacked roughly two ships for every 100 Hormuz crossings during the third quarter. The International Maritime Organization recorded at least nine sailors killed, 18 injured and three missing since July.
Michelle Wiese Bockmann, a senior maritime intelligence analyst at Windward, described the conditions under which crude continued to move:
Volumes are getting through but they're getting through at a time of extremely high maritime risk,
The cost of shipping crude from the Persian Gulf to China had reached as much as $1 million per tanker per day. That is a measure for that route, not a quoted freight rate for Thailand. It illustrates the cost pressure surrounding the same regional supply that Thailand depends on.
Bob McNally, president of Rapidan Energy and a former energy adviser to President George W. Bush, described the use of military protection and transfers between ships:
It's an inefficient way to move commodities, not just oil, out of Hormuz,
The United Kingdom Maritime Trade Operations Centre also recorded an incident in which Iran's Revolutionary Guard ordered a tanker to turn around or face attack. The vessel complied. Cargoes moving through the strait therefore do not establish that normal freedom of navigation has returned.
For Thailand, the unresolved issues are specific: whether the 8,419 million liters outside the country will arrive as scheduled, whether refinery production will recover, and whether distribution can meet demand in individual locations. The assessment gives no date for restored Hormuz access, no delivery timetable for every confirmed cargo and no announced decision to release emergency reserves.
Key Points
- Thailand counts at least 118 days of oil supply, but only 51 days are held domestically.
- Domestic cover includes 26 days of commercial stocks and 25 days reserved for emergencies.
- Another 67 days depend on crude in transit or confirmed purchases awaiting shipment.
- Middle Eastern supply accounted for 53% of Thailand's January crude sourcing breakdown.
- October 6 diesel and gasoline sales exceeded finished production by a combined 3.372 million liters.
- March shortages occurred despite a reported 107 days of reserves, demonstrating the importance of distribution as well as national stocks.
- Hormuz shipments continue, but attacks, crew casualties and costly transport arrangements leave deliveries exposed to disruption.