

A construction slump meets a shipping rebound
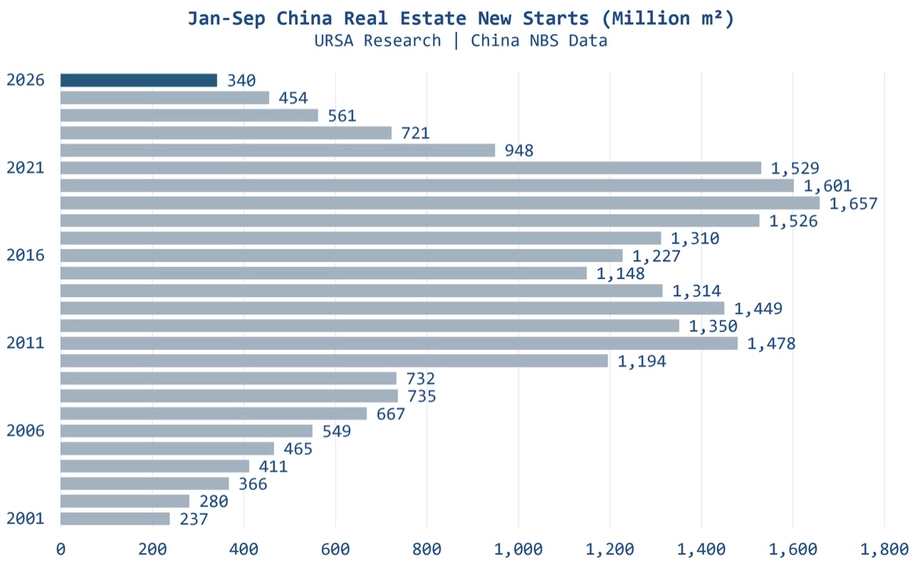
China began construction on 340.31 million square metres of property in the first nine months of 2026, down 24.9% from a year earlier, according to National Bureau of Statistics figures released on October 19. Residential starts fell even faster, dropping 25.4% to 247.74 million square metres.
Contents
- A construction slump meets a shipping rebound
- What the construction figures measure
- The long retreat from the building boom
- Investment and developer funding keep falling
- Buyers are shifting toward existing properties
- The slowdown reaches every major region
- Why iron ore shipments are still growing
- Guinea changes the distance calculation
- Two forces are pulling the market apart
- Key Points
The latest figures extend a retreat that has taken annual construction starts back to levels last seen in 2002. Research by Ursa Shipbrokers puts the decline since 2019 at 74%, from 2.27 billion square metres to 588 million square metres in 2025. Starts in the first nine months of 2026 were almost 80% below the equivalent period in 2019.
For companies carrying the raw materials used to make steel, the surprising development is that Chinese iron ore imports are still growing. They increased 4.1% in the first nine months of 2026, even as property investment, construction and new building sales all contracted.
Shipping executives are increasingly optimistic because cargo demand depends on distance as well as weight. Mineral shipments from Guinea and changes in sourcing can keep vessels occupied for longer, supporting freight markets while China's traditional construction engine weakens.
What the construction figures measure
The National Bureau of Statistics defines a construction start as the point when foundation excavation, ground treatment or permanent piling begins. The figure counts the planned floor space of the whole building, including its different storeys. It gives a measure of projects entering the construction pipeline.
The bureau's January to September release includes indicator definitions, regional classifications and an explanation of the comparable basis used for year-on-year changes. The property development survey covers legal entities engaged in property development and business operations, with a comprehensive survey conducted every month except January. Prior-year figures for investment, new property sales area and other indicators are revised under the statistical reporting system and statistical enforcement checks, with growth rates calculated on a comparable basis.
The bureau's January to July release, published on August 18, recorded 267 million square metres of new starts, down 24%. By September, the cumulative decline had widened to 24.9%. Residential starts accounted for about 73% of the total in both periods.
Buildings under construction covered 5.65221 billion square metres in January through September, down 12.8%. That category includes projects begun in earlier years, projects resumed after suspension, and projects worked on during the reporting period that were subsequently paused. Its much larger size reflects years of accumulated construction activity.
Completed floor space reached 232.71 million square metres, down 25.1%. Completions count buildings that meet the conditions for use and delivery. For households awaiting a finished home, that measure captures a different stage of the property cycle from the launch of a new project.
The long retreat from the building boom
Ursa's historical comparison shows a contraction across several stages of development. Floor space under construction has fallen 32% since 2021, while completions have dropped approximately 40% from their 2023 levels.
China's return to construction volumes associated with 2002 comes under very different circumstances. The country was then entering a major building expansion after joining the World Trade Organization. The current market has recorded six consecutive years of falling starts.
The main milestones show how the slowdown has moved through the construction pipeline:
- 2002: Construction starts were at levels comparable with those reached after the recent collapse, according to Ursa.
- 2019: Annual starts totalled 2.27 billion square metres, the reference point for Ursa's 74% decline.
- 2021: The comparison year for the subsequent 32% fall in floor space under construction.
- 2023: The comparison year for the approximately 40% decline in completions.
- 2025: Annual starts fell to 588 million square metres.
- January through September 2026: Starts totalled 340.31 million square metres, down 24.9% from the same period in 2025.
Fewer new projects reduce the flow of work entering future construction stages. Meanwhile, the decline in completions shows that weakness extends to the delivery end of the pipeline, where buildings become ready for occupation.
Investment and developer funding keep falling
Property development investment totalled 5.3364 trillion yuan in the first nine months of 2026, down 20.6%. Residential investment accounted for 4.1125 trillion yuan and fell 20.5%. The bureau's investment measure includes spending on buildings, land development, land acquisition and related work.
The pace of decline deepened after July. Investment had fallen 19.2% over the first seven months, while funds available to developers were down 20.3%. By September, the funding decline had widened to 21.6%, leaving developers with 5.6813 trillion yuan.
Domestic loans to developers fell 33.1% to 762.4 billion yuan in January through September. Funds raised by developers themselves dropped 21.4% to 2.0572 trillion yuan. Deposits and advance payments from buyers fell 14.8% to 1.7982 trillion yuan, while individual mortgage funding declined 22.1% to 767.8 billion yuan.
Developers therefore faced shrinking receipts from several directions at once. Lower sales weaken cash coming from customers, while reduced borrowing limits another source of money for construction. The figures help explain why a smaller pipeline of new projects has accompanied lower investment.
Buyers are shifting toward existing properties
Sales of newly built commercial property covered 564.83 million square metres in January through September, down 13.2%. Their contract value fell 13.9% to 5.3799 trillion yuan. Residential sales area declined 13.8%, while residential sales value fell 13.7%.
Existing properties moved in the opposite direction. Ministry of Housing and Urban-Rural Development figures put the area covered by online contracts for resales at 617.46 million square metres, up 10.7%. That exceeded the area sold in newly built commercial property by 52.63 million square metres, or about 9.3%.
The resale figure appears in the bureau's January to September release, whose note 6 identifies the ministry as the data source and defines the measure as the total area covered by online transaction contracts for second-hand properties in urban areas during the reporting period.
The two measures track different parts of the market. Resales transfer existing buildings between owners, while new property sales generate receipts for developers. More trading in existing homes can therefore coexist with falling funds for companies building new ones.
Unsold completed commercial property totalled 748.25 million square metres at the end of September, down 1.5% from a year earlier. Within that total, property held for sale for less than three years covered 541.97 million square metres, down 5%. The bureau defines this inventory as completed space available for sale or lease.
The slowdown reaches every major region
The bureau's January through July regional figures show falling development investment across eastern, central, western and northeastern China. The eastern region, which includes Beijing, Shanghai, Guangdong and several coastal provinces, accounted for 2.5485 trillion yuan, about 59% of national property investment.
Eastern investment fell 19.7%. Central China recorded a 20% decline to 840.9 billion yuan, while western investment fell 15.9% to 835.5 billion yuan. Northeastern China experienced the steepest percentage contraction, at 29.7%, with investment of 76 billion yuan.
New commercial property sales also declined across all four regions. Sales area fell 11.2% in the east, 11.5% in central China and 12% in the west. The northeast recorded a larger drop of 21.5%, alongside a 23.8% decline in sales value.
The regional figures place the national slowdown in context: weakness stretches from the largest coastal investment markets to the much smaller northeastern market. Western China had the smallest investment decline among the four regions, although its spending still fell by almost one sixth.
Why iron ore shipments are still growing
Property construction has historically been a major source of Chinese steel demand. Iron ore supplies the iron used in conventional steelmaking, while metallurgical coal is processed into coke, which helps remove oxygen from the ore and provides heat in blast furnaces.
Falling building activity puts pressure on that demand chain. Yet Ursa points to greater reliance on overseas ore, inventory accumulation and changing trade patterns as reasons Chinese iron ore imports increased 4.1% in the first nine months of 2026.
Imported cargo can enter storage before being consumed, and a greater share of overseas supply can support seaborne trade even when a major steel customer is contracting. Shipping demand therefore responds to purchasing and sourcing decisions as well as activity at building sites.
Dionysios Tsilioris, a researcher at Ursa Shipbrokers, said the historical connection between Chinese property starts and earnings for capesize vessels had weakened considerably. He described the property downturn as part of a broader economic change:
"Declining real estate construction is a broader symptom of a changing Chinese economy, particularly post-covid, moving away from one heavily focused on fiscal stimulus and infrastructure towards a more consumer and services-oriented model," Tsilioris said.
Capesize vessels are large bulk carriers commonly used to transport iron ore and coal. Their earnings depend on how much cargo needs moving, how long voyages take and how many ships are available to carry it.
Guinea changes the distance calculation
At the Maritime CEO Forum in Monaco, Milena Pappas of Star Bulk highlighted Guinea's growing bauxite exports and Simandou iron ore production as sources of longer voyages. Bauxite is the principal ore used to produce aluminium, giving the shipping market another mineral trade beyond the steel supply chain.
The central measure is tonne miles: cargo weight multiplied by distance travelled. Moving the same weight of ore over a longer route creates more transport work and keeps a vessel committed for longer. That can support demand for ships without an equivalent rise in the amount of material consumed.
Lars-Christian Svensen, chief executive of Himalaya Shipping and Bruton, pointed to that mechanism when describing the market's prospects:
"This is a tonne-mile story. You've just seen the beginning," Svensen said.
John Michael Radziwill, chairman of CTM, suggested at the forum that dry bulk was approaching a "generational rate rally". His outlook reflects the optimism among owners who expect changing mineral routes to support freight earnings.
Two forces are pulling the market apart
China's property figures and the shipping industry's optimism describe different parts of the same supply chain. Developers are starting fewer buildings, spending less and receiving less funding. Shipowners can still benefit when Chinese buyers import a greater share of their ore or source cargo from more distant suppliers.
The pressures also operate on different schedules. A construction start enters a project pipeline that may take years to finish. An imported shipment creates immediate transport work, even if the ore is stored after unloading. Freight earnings can therefore improve during a period of falling property activity.
How long longer voyages and changing supply patterns can offset weaker construction demand is unresolved. The figures give no timetable for a recovery in property starts, and the shipping executives' comments offer no firm date for a sustained freight rally.
For steel suppliers, the central development remains the sharp reduction in China's building pipeline. For capesize owners, the focus has widened to include where cargo originates and how long ships spend carrying it. The rise in iron ore imports alongside falling starts captures that split.
Key Points
- China's property starts fell 24.9% to 340.31 million square metres in January through September 2026.
- Ursa puts the decline in annual starts since 2019 at 74%, returning activity to levels comparable with 2002.
- Property investment fell 20.6%, while funds available to developers dropped 21.6% in the first nine months.
- New property sales area declined 13.2%, while the area covered by resale contracts rose 10.7%.
- Chinese iron ore imports increased 4.1% despite the construction downturn.
- Shipping executives expect longer mineral voyages, including trade from Guinea, to support demand for bulk carriers.